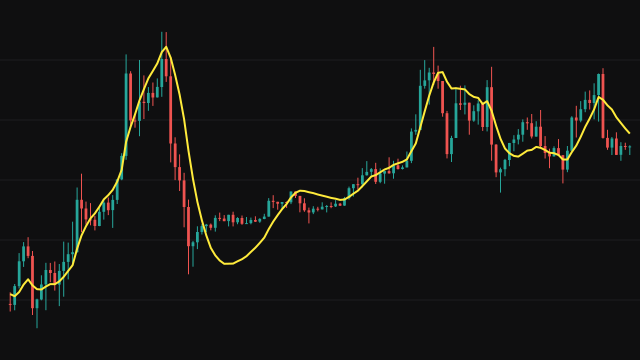
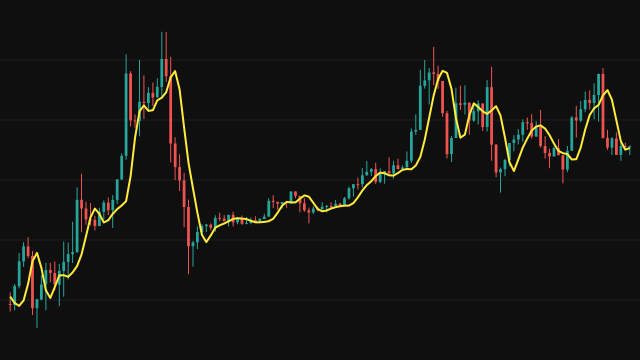
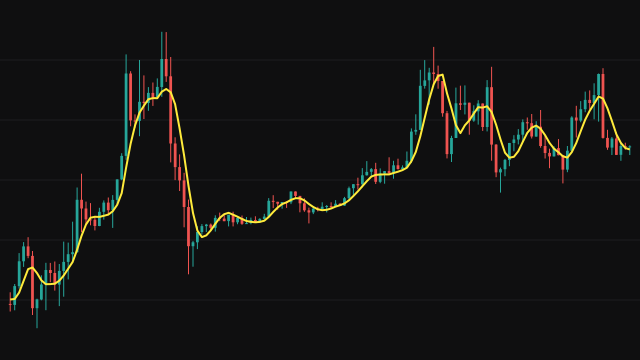
The Hull Moving Average is built from linearly weighted averages, in which the newest bar carries the most weight. It takes a weighted average over half the period and another over the full period. Twice the half-period average less the full-period average leans ahead of both and cancels most of their lag. That difference is then smoothed by one more weighted average over the square root of the period.
Half the period and the square root of the period are each rounded to the nearest whole bar and never fall below one. All three averages answer from the first bar: until a window is full they weight the bars seen so far 1, 2 and up and divide by the sum of those weights, so the line is drawn from the start of the chart.
How to read Hull Moving Average (HMA)
Read the HMA as a fast, smooth trend line. It follows price closely and turns quickly, so its slope is the main thing to read: rising describes an uptrend, falling a downtrend, and a change of slope an early sign the move is fading.
The lag reduction comes from extrapolation, so after a sharp reversal the line overshoots price before it settles, and in a range it changes direction often. The first bars use short windows and track price almost exactly.
Settings
- Period
- Length of the full weighted average. The half-period and square-root windows are derived from it. Longer periods are smoother and slower.
- Source
- The price series the average is taken from, the close by default.
Frequently asked questions
Why does the HMA lag less than a weighted average of the same length?
Twice the half-period average less the full-period one extrapolates ahead and cancels most of the lag. The final short smoothing then removes the noise that step adds.
Why does it overshoot after a sharp turn?
The extrapolation projects the recent difference between the two averages forward. After a sudden reversal that difference is large, so the line briefly runs past price.
Why is there a value on the first bar?
Each weighted average uses the bars available until its window is full, so the line exists from the start, resting on fewer bars at first.