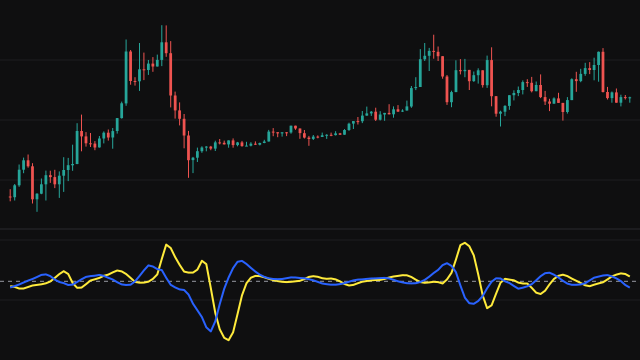
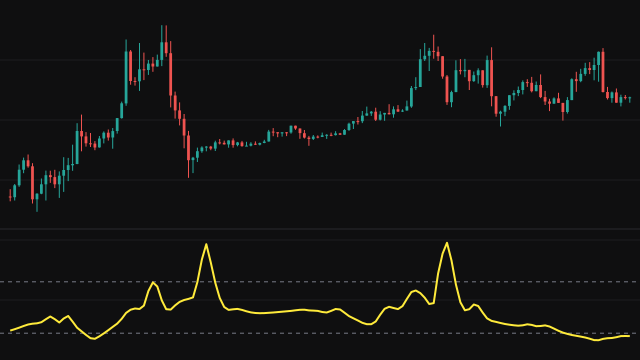
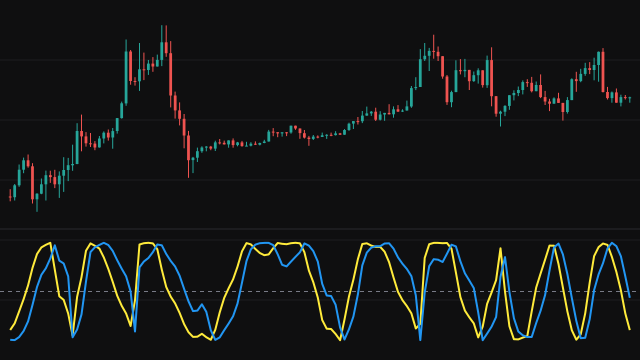
This study reports the phase of the market's dominant cycle. Price is smoothed with weights 4, 3, 2 and 1 over the last four bars, then a four-tap Hilbert transform splits it into an in-phase component and a quadrature component a quarter cycle apart. The width of every Hilbert stage follows the smoothed dominant cycle period, which the study measures from how far the phasor turns each bar, holds between 6 and 50 bars and smooths, so the transform adapts to the cycle it is measuring.
The in-phase and quadrature parts are each smoothed 0.2 / 0.8 against their previous bar. The plotted phase is the angle of that smoothed pair, the quadrature over the in-phase, computed with a quadrant-aware arctangent so it covers the whole circle from -pi to pi. On a bar where both parts are zero the previous phase is kept.
How to read HT_DCPHASE: Hilbert Transform Dominant Cycle Phase
In this calculation the phase falls as a cycle unfolds and wraps from -pi back up to +pi once per cycle. The dashed levels at zero and at plus and minus pi/2, about 1.57, split the circle into quarters, so you can see which quarter of its cycle the market is in.
A phase that falls at a steady rate means a clean cycle. A phase that stalls, jumps or runs the other way means the market is not cycling at the moment, and any timing read from it is unreliable.
Settings
- Source
- The price series the cycle is measured on. The default is the typical price, (high + low + close) / 3.
Frequently asked questions
Why does the line jump from bottom to top?
The phase is an angle. It falls through each cycle and wraps from -pi to +pi when it completes a full turn. The jump is the start of a new turn, not a sudden move in price.
Is the phase in degrees?
No, in radians. Pi radians is 180 degrees, so the pane runs from about -3.14 to +3.14.
Why is there no period setting?
The study measures the cycle period itself from the data and uses it to tune the transform, so there is nothing to set beyond the source.