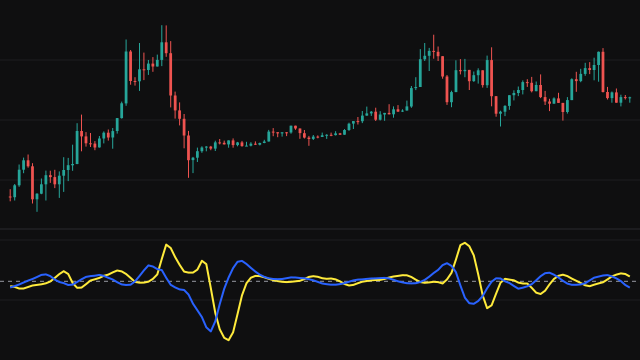
This study draws the market's dominant cycle as a clean sine wave. Price is smoothed with weights 4, 3, 2 and 1 over the last four bars, then a four-tap Hilbert transform splits it into an in-phase and a quadrature component, each smoothed 0.2 / 0.8 against its previous bar. The width of every Hilbert stage follows the smoothed dominant cycle period, measured each bar from how far the phasor turned and held between 6 and 50 bars, so the transform adapts to the cycle it is measuring.
The phase is the angle of the quadrature over the in-phase part, from a quadrant-aware arctangent, and is kept from the previous bar when both parts are zero. The Sine line is the sine of that phase, and the LeadSine line is the sine of the phase plus 45 degrees. In this calculation the phase falls as a cycle unfolds, so LeadSine repeats the Sine line about an eighth of a cycle later rather than ahead of it.
How to read HT_SINE: Hilbert Transform - SineWave
Both lines run between -1 and +1. While the market cycles they swing together, with LeadSine an eighth of a cycle behind Sine, and they cross twice per cycle: just after each crest and just after each trough of the Sine line. Read the pair for where the market is in its cycle and how regular that cycle is; the crossings confirm a turn of the Sine line rather than anticipate it.
When the market trends, the phase stalls and the two lines flatten, drift apart or cross repeatedly without a clean wave. Check that the lines are swinging in a regular rhythm before reading anything into them.
Settings
- Source
- The price series the cycle is measured on. The default is the typical price, (high + low + close) / 3.
Frequently asked questions
Why are there two lines?
LeadSine is the sine of the phase plus 45 degrees. It traces the same wave as Sine, offset by an eighth of a cycle, and the two cross just after each crest and trough of the Sine line.
Why does LeadSine not turn first?
Adding 45 degrees puts a line ahead only when the phase rises. Here the phase is the angle of the quadrature part over the in-phase part, and that angle falls as a cycle unfolds, so LeadSine reaches each value an eighth of a cycle after Sine. The line keeps the name LeadSine.
Why do the lines stay flat for long stretches?
A flat stretch means the measured phase stopped advancing, which happens when price trends instead of cycling. The wave only swings while there is a cycle to follow.
Does the value say how far price will move?
No. The lines are sines of an angle, always between -1 and +1, so they show timing within the cycle and nothing about its size.