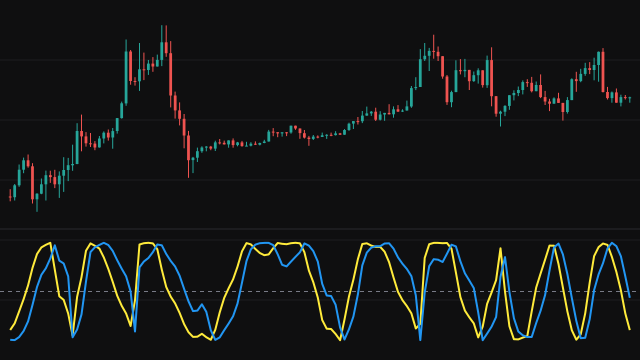
This study splits the market's dominant cycle into two parts a quarter cycle apart. Price is smoothed with weights 4, 3, 2 and 1 over the last four bars, then a four-tap Hilbert transform produces a detrended series, an in-phase component (the detrended value three bars back) and a quadrature component. Two further Hilbert stages advance each part, and the in-phase and quadrature lines are combined from them and smoothed 0.2 / 0.8 against their previous bar.
The width of every Hilbert stage follows the smoothed dominant cycle period. That period is measured each bar from how far the phasor turned, held between 6 and 50 bars, starts from 15, and is smoothed, so the transform adapts to the cycle it is measuring. The two plotted lines are the smoothed InPhase and Quadrature components, in price units.
How to read HT_PHASOR: Hilbert Transform Phasor Components
In a cycling market the two lines oscillate around zero with the Quadrature line a quarter cycle ahead of or behind InPhase, so their crossings come at regular spacing. The angle of the pair is the cycle phase and its length is the cycle amplitude, which other Hilbert studies build on.
The lines are in price units, so their size grows with volatility and with the price level. When they shrink toward zero and stop alternating, there is no clear cycle to read.
Settings
- Source
- The price series the cycle is measured on. The default is the typical price, (high + low + close) / 3.
Frequently asked questions
What are in-phase and quadrature?
Two views of the same cycle a quarter turn apart, like the cosine and sine of one angle. Together they give the cycle's phase and amplitude.
Why are the values so small compared with price?
They measure the detrended swing, not price itself, so they hover around zero and scale with how far price oscillates.
How is this related to the phase and period studies?
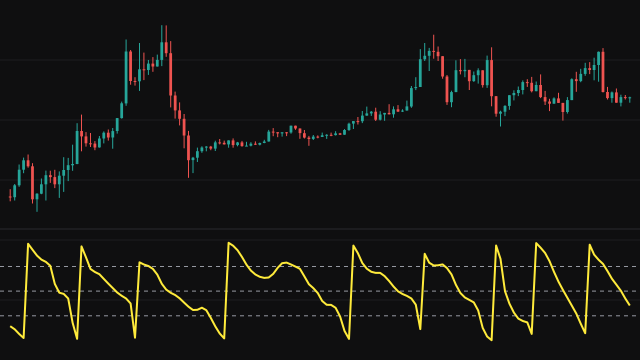
The phase study plots the angle of these two lines, and the period study plots how fast that angle turns. All three share the same adaptive transform.