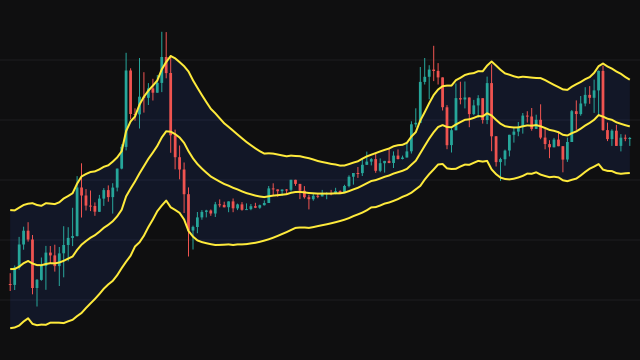
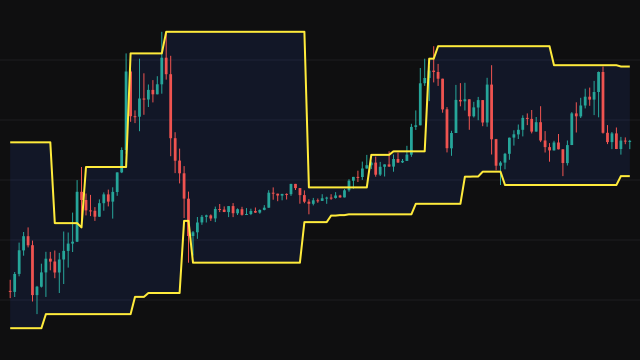
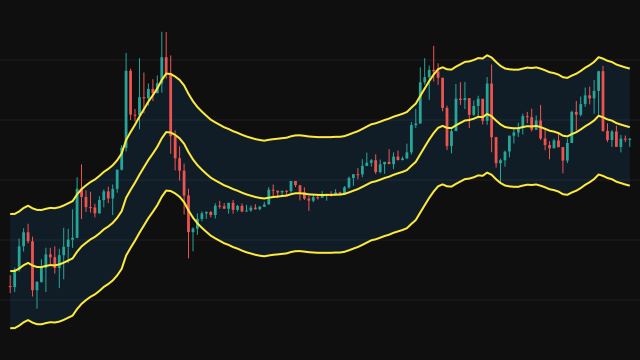
These bands follow the bar midpoint with an asymmetric rule. When the midpoint rises above the previous upper band, the upper band jumps to the bar's high. Otherwise the upper band is set above the bar's high by a share of the gap between the previous upper band and the midpoint, so it eases down toward price. The lower band does the mirror image with the low. Both bands start at the first source value.
Volatility on a bar is the larger of the two distances from the midpoint to the previous bands. The study keeps a ten-bar running sum of that volatility, scaled by a constant from the period (one tenth at a period of 10 or less, which makes it a ten-bar average), and a slow exponential average of that sum. Relative volatility, this bar's volatility over that average, held between one and a cap set by the period, sets the share of the gap a band keeps: higher relative volatility shrinks the share, so the band falls back toward price faster.
The constants that shape the response come only from the period, so a longer period keeps a larger share of the gap and gives bands that hold their level longer.
How to read Jurik Volatility Bands (JBANDS)
The upper band hugs the highs in a rally and the lower band hugs the lows in a decline, while the opposite band lags behind. The gap between them is a measure of recent range. A band that suddenly closes in on price after a quiet spell shows volatility picking up.
When price pushes through a band it snaps to the bar's extreme, so a series of snaps on one side marks a persistent move. The bands are adaptive and can change shape quickly, so read them alongside the price structure.
Settings
- Period
- Sets the constants that shape how quickly the bands fall back and the cap on relative volatility. Longer periods give slower, steadier bands.
- Source
- The series whose first value seeds both bands, the close by default.
Frequently asked questions
Why does the upper band sometimes jump straight to the high?
When the bar midpoint rises above the upper band, the rule sets the band to that bar's high instead of easing toward it.
What does relative volatility do?
It compares this bar's distance from the bands with its recent average. Higher values let the bands close the gap to price faster, up to a cap set by the period.
Where does the source setting come in?
Only in the starting value of both bands. After the first bar the bands follow the bar's high, low and midpoint.