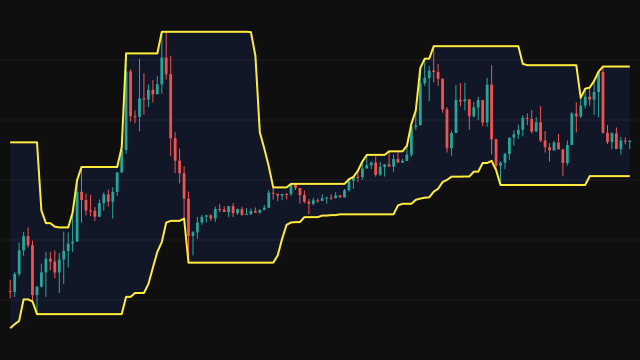
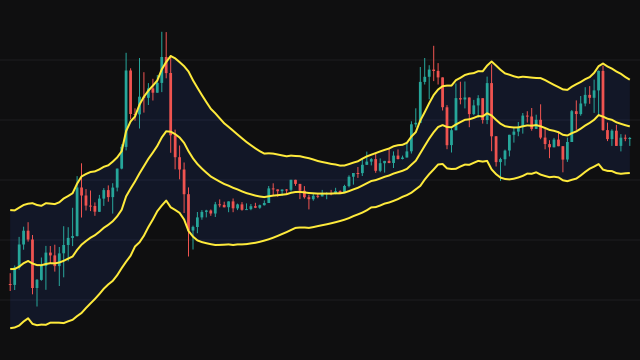
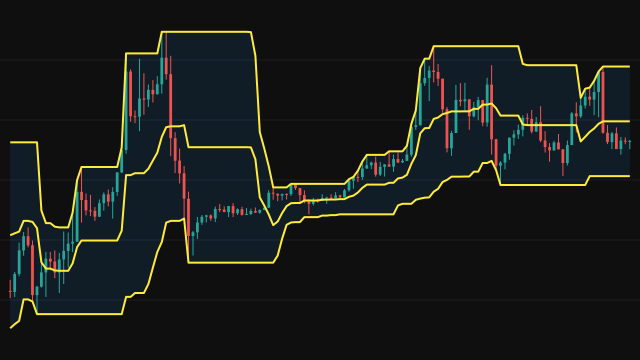
MA Envelope draws a moving average of the source and two bands a fixed percentage of that average away from it. With the default 1 percent, the upper band is the average times 1.01 and the lower band the average times 0.99, so the channel is always the same proportional width whatever the market is doing.
The average can be an exponential, simple or weighted mean, chosen in the menu. Each one answers from the first bar. The exponential mean divides out the weight of the history that does not exist yet, so its early values are not pulled toward zero. The simple mean averages however many bars exist until the window holds Length of them. The weighted mean gives the newest bar weight Length and the oldest weight 1, and counts bars before the start of the chart as zero, so its first values sit below price until the window fills.
How to read MA Envelope (MAE)
Read the bands as a fixed-distance stretch from the average. A close outside the upper band means price has run more than the chosen percentage above its mean, and a close below the lower band the same on the downside. In a range these are places where price has often reverted; in a strong trend price can ride along one band for many bars.
Because the width does not follow volatility, one percentage will not suit every instrument or timeframe. Set it so that the bands contain most of the recent price action, and widen it for a more volatile market.
Settings
- Source
- The price series the average and its bands are built from.
- Length
- How many bars the average covers. A longer length gives a smoother, slower centre line.
- Percentage
- The distance of each band from the average, as a percentage of the average. A larger value widens the envelope.
- MA Type
- The average the envelope is built around: SMA (simple), EMA (exponential, the default) or WMA (linearly weighted).
Frequently asked questions
How is this different from standard deviation bands?
Standard deviation bands widen and narrow with the scatter of price around the average. An envelope stays a fixed percentage of the average, so its width only changes when the price level changes.
Why does the WMA line start well below price?
The weighted mean counts bars before the start of the chart as zero while keeping the full window's total weight, so until Length bars exist its value is pulled down. It settles once the window is full.
What percentage should I use?
Pick one that contains most of the recent bars. On an hourly chart of a quiet instrument that may be well under 1 percent; on a volatile one or a daily chart, several percent.