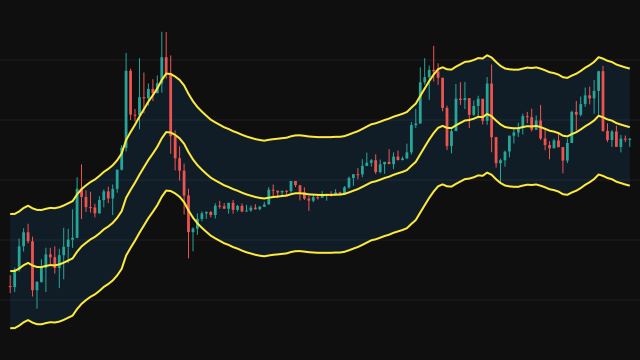
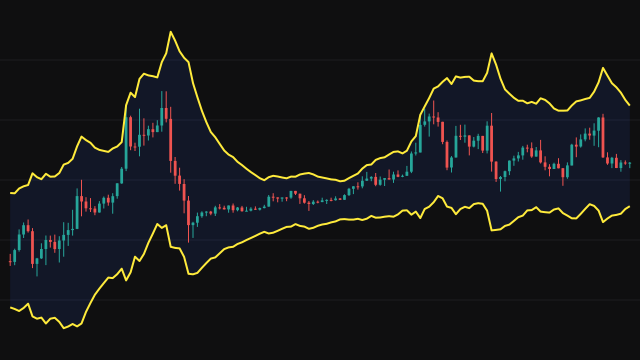
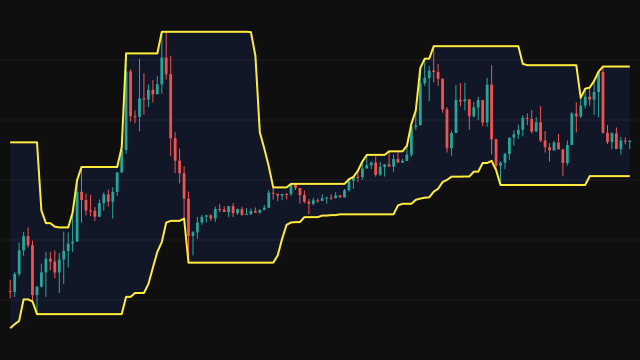
This channel places bands around an exponential moving average at a distance set by the average true range. The middle line keeps a running sum and a running weight that both decay by the exponential factor, and divides one by the other, so on the first bar it equals the source and it needs no seed window.
The true range of a bar is the largest of its high minus its low, the distance from its high to the previous close and the distance from its low to the previous close. The study smooths it with a running average whose weight is one over the length, starting from zero, and divides out the weight that zero start still holds, so the average true range is unbiased from the first bar.
The upper band is the middle line plus the multiplier times the average true range, and the lower band is the middle line minus it.
How to read Keltner Channel (KCHANNEL)
In a steady trend price tends to stay on one side of the middle line and lean on one band. A close outside the channel is a move larger than the typical bar range would suggest, which trend traders read as strength and range traders as stretch. Some traders treat a pullback to the middle line inside a trend as an entry area.
Because the width comes from true range rather than closing deviation, the channel does not widen just because closes drift away from the average, and it does widen on gaps. It still lags a sharp turn by roughly the length.
Settings
- Source
- The price series the middle exponential average follows, the close by default.
- Length
- The length of the exponential average and of the true range smoothing. Longer is smoother and slower.
- ATR Multiplier
- How many average true ranges the bands sit from the middle line. Larger values give a wider channel.
Frequently asked questions
Why is the channel present from the first bar?
Both the average and the true range smoothing correct for their zero start, so they have usable values from bar one.
How is this different from a standard deviation band?
The width comes from bar ranges and gaps instead of from how far closes stray from the mean, so a steady drift in closes does not widen it, while gaps and large bars do.
What is the first bar's true range?
With no previous close, the first bar compares against its own close, so its true range is its high minus its low.