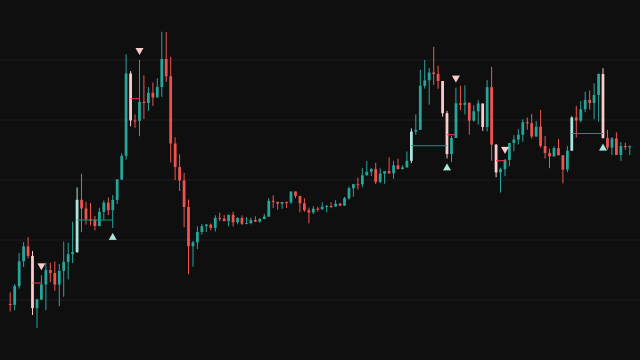
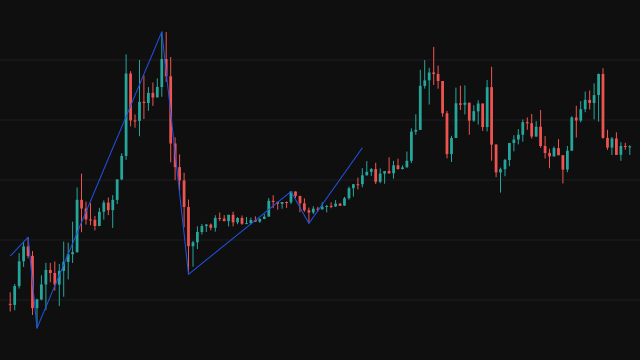
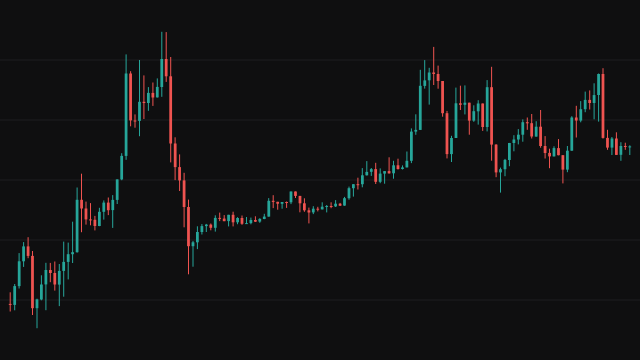
Note. The fill level lines are drawn on every bar while a side is armed, so they also show levels that a newer displacement candle replaced and levels that were never filled, whereas the original draws a level only from the newest displacement candle to the bar that fills it; whether a level will be filled is known only on the fill bar, and a study cannot go back and blank the bars it has already drawn. Every level shown agrees with the original.
A displacement candle is a bar that moves price a long way in one direction with little wick. Price crossed that range so quickly that few orders were filled inside it, leaving what is often called a liquidity void, and traders watch for price to come back into part of it. This study finds those candles, plots the level inside each one that price has to reach, and signals the bar on which it does.
A candle qualifies when it passes every filter that is switched on. The ATR filter asks for a high to low range larger than the average true range times the multiplier. The body filter asks for the body to cover at least Body % Above of the range. The optional body size filter also asks for a range at least the multiplier times the previous bar's range. A qualifying bearish candle is recoloured light red and a bullish one light green, and it arms its side.
The level is Fib Value of the newest qualifying candle's range: down from the high of a bearish candle, up from the low of a bullish one. A short signal fires when the high crosses up through the bearish level of an armed side, and a long signal when the low crosses down through the bullish level. A signal disarms its side until the next displacement candle, and the optional time and date filters limit which bars may signal. A small table shows the day's percentage change (each bar's change in close added up since the day began, the first bar measured from the previous day's last close), the day's volume so far against the previous day's total, and both days' volume in lakhs.
How to read Liquidity Void Fill Scanner
A recoloured candle says a strong one-sided move has just happened. While its side is armed, the Short Fill Level or Long Fill Level line shows the price that would fill the void. A triangle above a bar is a short signal: price has rallied back into a bearish void, where sellers may defend it. A triangle below a bar is a long signal: price has dipped back into a bullish void. The line ends on the signal bar.
If a newer displacement candle arrives before the fill, the line moves to the newer candle's level. A signal only says price has reached the level, not that it will turn there; in a strong trend price often runs straight through, so traders usually wait for a reaction at the level.
Settings
- Long Signals
- Show the bullish side: the light green candles, the long triangles and the Long Fill Level line.
- Short Signals
- Show the bearish side: the light red candles, the short triangles and the Short Fill Level line.
- Fib Value
- How far into the candle the level sits, from 0 at the start of the move to 1 at its far end. 0.5 is the midpoint.
- Apply ATR Filter
- Require a displacement candle's range to exceed the average true range times the multiplier.
- ATR Length
- Bars in the average true range used by the ATR filter. The filter blocks every candle until it has enough bars.
- ATR Multiplier
- How many average true ranges a candle must span. Higher values keep only larger candles.
- Apply Body % Filter
- Require a displacement candle's body to cover at least the set share of its range.
- Body % Above
- The smallest body as a percentage of the candle's range. At 80 the wicks together may be at most a fifth of it.
- Apply Body Size Filter
- Also require a full body and a range at least the multiplier times the previous candle's range.
- Body Size Multiplier (x)
- How many times the previous candle's range a displacement candle must reach when the body size filter is on.
- Apply Time Filter
- Allow signals only on bars that open inside the window below, read on the chart's clock.
- Time From (hour)
- The hour the signal window opens, on a 24 hour clock.
- Time From (minute)
- The minute the signal window opens.
- Time To (hour)
- The hour the signal window closes. A bar opening at the closing time is outside it.
- Time To (minute)
- The minute the signal window closes.
- Apply Date Filter
- Allow signals only on bars of the single date below, read on the chart's calendar.
- Day
- Day of the month for the date filter.
- Month
- Month, 1 to 12, for the date filter.
- Year
- Four digit year for the date filter.
- Display Table
- Show the table of the day's percentage change and volume against the previous day.
Frequently asked questions
Why does the fill level line sometimes stop without a signal?
It does not stop without one: the line runs while its side is armed and ends on the bar that fills the level. A line still running at the right edge of the chart is a void that has not been filled yet. Where the line changes level before a signal, a newer displacement candle replaced the level before the fill.
What do the volume figures in the table mean?
Vol is the volume traded so far today and PD Vol the previous day's total, both in lakhs (hundred thousands). Vol %Chg compares today's running volume with the previous day's total, so it starts each day near minus 100 percent and climbs as the day trades. The day boundary follows the chart's calendar.
Does the scanner check other symbols?
No. It runs on the chart's own instrument only and reports what it finds in the bars loaded on the chart.