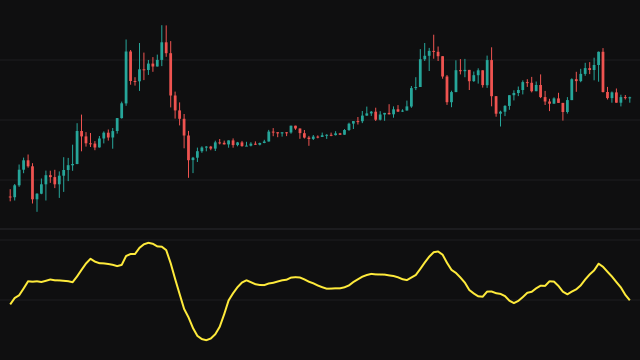
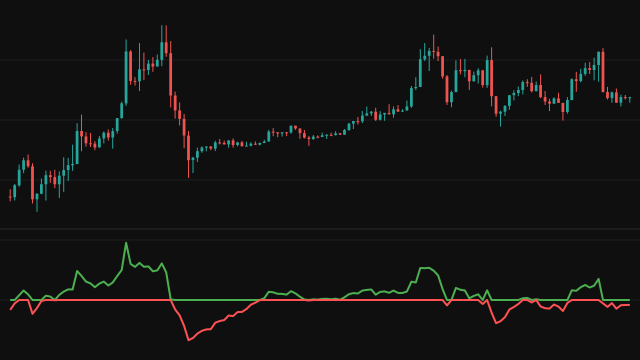
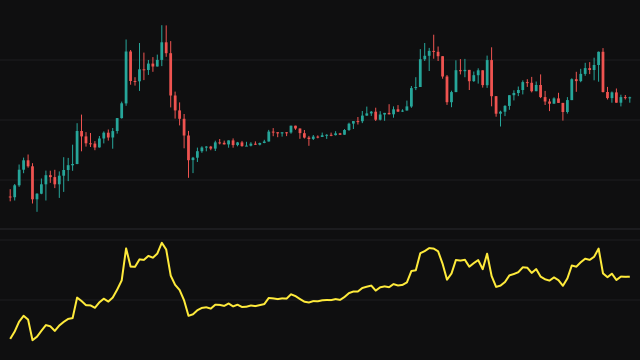
The Logistic Function study measures how far the source sits from its 200-bar simple moving average and squashes that distance into the range 0 to 1. The formula is 1 / (1 + exp(-k * (source - SMA200))). When price sits exactly on its average the result is 0.5. Above the average it rises towards 1, and below the average it falls towards 0, but it never quite reaches either end.
The steepness k sets how quickly the curve saturates. The distance is measured in price units, so on a high-priced instrument a small k is needed to keep the line away from its limits. The average needs 200 bars of history, so the line starts on bar 200. Where the exponent is above 700, far below the average, the curve is already below 1e-304 and the result is written as exactly 0.
How to read Logistic Function (SIGMOID)
Read 0.5 as price at its long average, values near 1 as price stretched well above it, and values near 0 as price stretched well below it. Because the curve flattens at both ends, a large excursion and a very large one look almost the same, which keeps extreme bars from dominating the pane.
If the line spends most of its time pinned at 0 or 1, the steepness is too high for the instrument's price level: lower k until the swings in between are visible. The 200-bar midpoint is fixed, so the study describes the position of price against a slow trend, not short-term momentum.
Settings
- Source
- The series compared with its own 200-bar simple moving average.
- Steepness (k)
- Multiplies the distance from the average before the curve is applied. A higher value makes the curve steeper, so it reaches 0 or 1 closer to the average.
Frequently asked questions
Why is the pane blank for the first 199 bars?
The midpoint is a 200-bar simple moving average, which has no value until 200 bars exist. The curve needs that midpoint, so it starts on bar 200.
Why is my line stuck at 0 or 1?
The distance from the average is in price units. On an instrument priced in thousands, a steepness of 0.5 turns even a small move into a large exponent. Lower the steepness until the line moves through the middle of the range.
Can I change the 200-bar average?
No. The midpoint length is fixed at 200 bars in this study. Only the source and the steepness are settings.