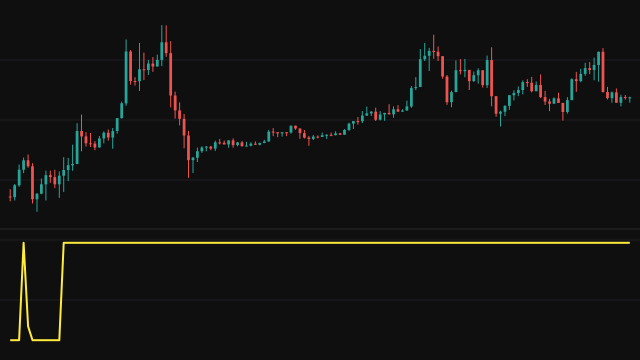
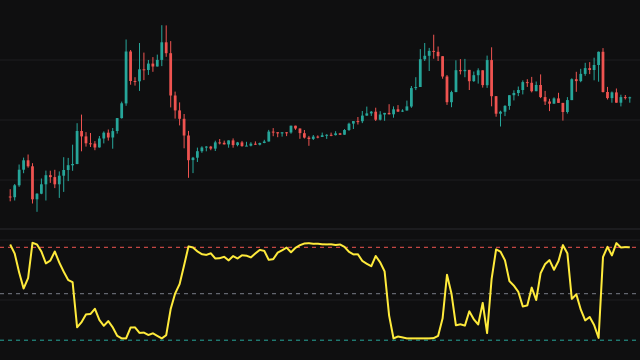
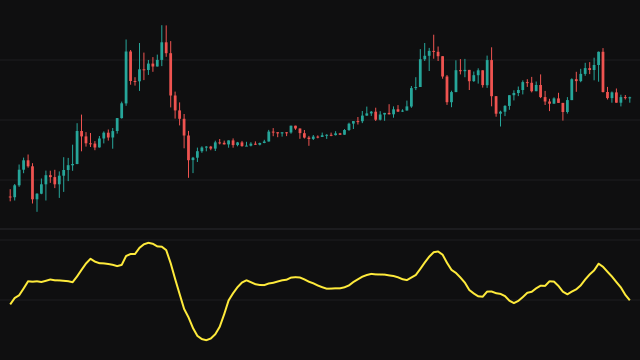
Rectified Linear Unit (ReLU) applies the rectifier function, which keeps a value when it is positive and replaces it with zero otherwise, to the distance between the source and its 20-bar simple moving average.
Two lines come out of it. ReLU Up is the larger of zero and the source minus the average, so it is positive only while the source is above the average. ReLU Down is the larger of zero and the average minus the source, drawn with its sign flipped, so it is negative only while the source is below the average. At any bar at most one of the two is away from zero. The average length is fixed at 20 bars, so both lines are blank for the first 19 bars.
How to read Rectified Linear Unit (ReLU)
The green line above zero shows how far the source sits above its 20-bar average, and the red line below zero shows how far it sits below. Only one side is active at a time, so the pane reads as a split view of the deviation: long stretches of green mean the source has held above its average, and a deepening red line means it is pulling further below.
The values are in price units, so they grow with the price level and with volatility. A switch from one side to the other is the source crossing its average, which is a lagging event like any moving average cross.
Settings
- Source
- The price series compared with its own 20-bar simple average.
Frequently asked questions
Can I change the 20-bar length?
No. The average length is fixed at 20 bars in this study, and only the source can be chosen.
Why is the lower line negative?
The rectified value on the weak side is always zero or positive. The study flips its sign so the weak side is drawn below zero and the two sides read as one picture.
What does it mean when both lines are at zero?
The source is exactly on its average. Both rectified values are zero at that moment.