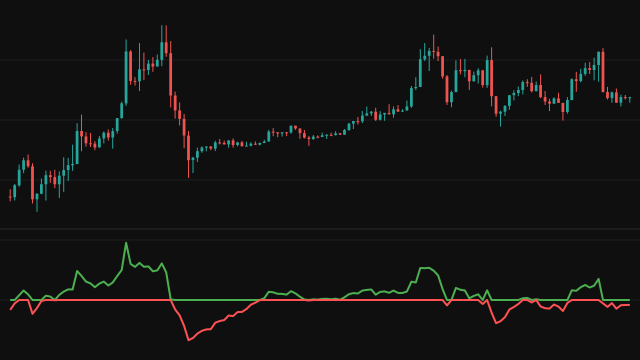
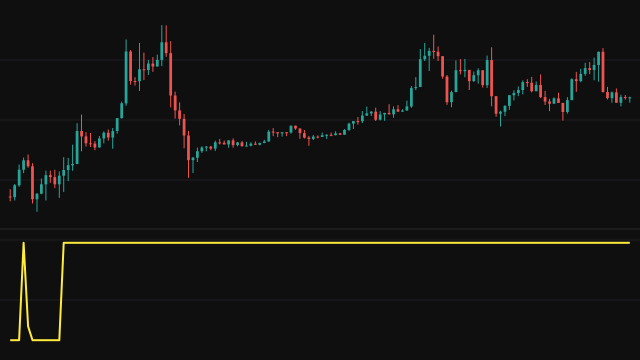
Poisson Distribution CDF (POISSONDIST) maps price onto a probability in three steps. First it min-max normalises the source over the last period bars, so the current value becomes a number from 0 at the window's low to 1 at its high; a flat window reads 0.5. Second it multiplies that position by Lambda Scale to get an event rate, lambda. Third it plots the Poisson cumulative probability that at most k events occur at that rate.
The probability is computed as one minus the regularized lower incomplete gamma function of k + 1 and lambda. The study evaluates that function with a series expansion for small lambda and a continued fraction for large lambda, using a Lanczos approximation of the log-gamma function. The series and the continued fraction each stop once a step changes the result by less than a relative 1e-10, or after 200 steps. When lambda is zero, all the probability sits at zero events and the result is 1.
How to read Poisson Distribution CDF (POISSONDIST)
The scale is inverted relative to price. When the source sits near the top of its range, lambda is high, so seeing at most k events is unlikely and the line falls toward 0. When the source sits near the bottom, lambda is low and the line rises toward 1. The 0.95 and 0.05 lines mark the tails, and 0.5 the middle.
The shape of the response depends on k and Lambda Scale together: the line crosses 0.5 roughly where lambda reaches k, so a larger k or a smaller scale keeps the line high across more of the range. It is a nonlinear lens on the position of price in its range, not a forecast.
Settings
- Source
- The series whose position in its recent range sets the event rate.
- Lookback Period
- How many bars, this one included, set the low and high of the range used for normalising.
- Threshold (k)
- The event count in P(X <= k). A larger k keeps the probability high until price is further up its range.
- Lambda Scale
- Multiplies the 0 to 1 range position to give lambda. A larger scale spans a wider range of event rates and makes the line fall faster as price rises.
Frequently asked questions
Why does the line fall when price rises?
A higher position in the range gives a higher event rate, and at a higher rate it is less likely that only k or fewer events occur. So the probability drops as price climbs its range.
Where does the line cross 0.5?
Roughly where lambda, the range position times Lambda Scale, is close to k. With the defaults of k = 5 and a scale of 10, that is near the middle of the range.
Why is the value exactly 1 on some bars?
When the source is at the very bottom of its window, lambda is zero, and with a zero rate there are never any events, so P(X <= k) is 1.