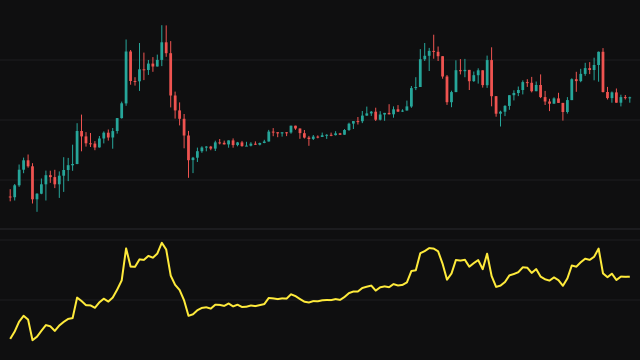
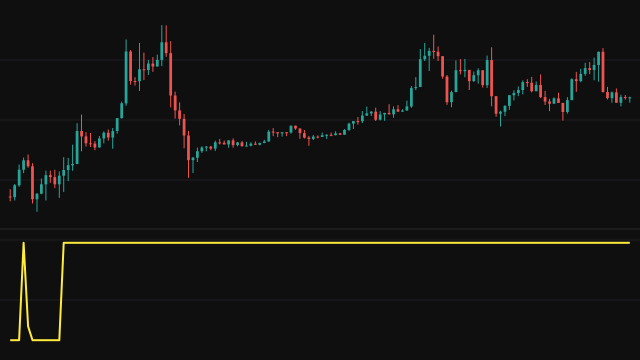
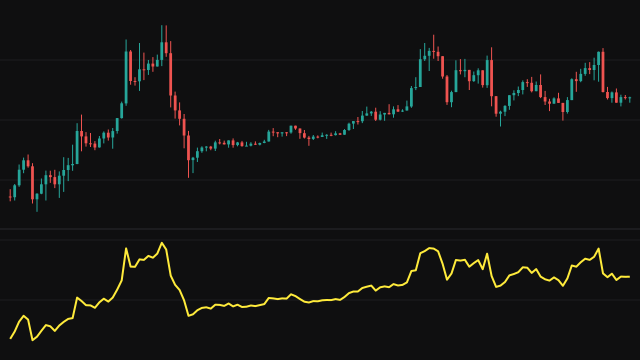
Slope, Linear Regression (SLOPE) fits a straight line through the most recent period values of the source by least squares and plots how steep that line is. Each value is placed at its position in the window, from 0 for the oldest to period - 1 for the newest, and the slope is (n * sum(x * y) - sum(x) * sum(y)) / (n * sum(x * x) - sum(x) ^ 2), where n is the number of values present.
The result is in price units per bar: a slope of 25 means the fitted line rises 25 points from one bar to the next. On the first bars of the chart the window holds only the bars that exist so far, and a missing value is skipped while keeping its place in the window. With fewer than two values present nothing is drawn.
How to read Slope, Linear Regression (SLOPE)
Above zero the fitted trend over the window is rising, below zero it is falling, and near zero price is moving sideways. The further from zero, the steeper the trend. A slope that keeps its sign but shrinks toward zero shows a trend losing pace, and a cross of zero shows the fitted line turning.
Because the value is in price units, it is larger on higher-priced instruments and in more volatile markets, so compare it with its own history rather than across symbols. A short period follows turns quickly but is noisy; a long one is smooth but lags.
Settings
- Period
- How many bars the line is fitted through. A longer period gives a smoother slope that turns later.
- Source
- The series the line is fitted to, such as the close or the bar midpoint.
Frequently asked questions
What unit is the slope in?
Price units per bar. A value of 10 on an hourly chart means the fitted line climbs 10 points each hour.
How is it different from momentum?
Momentum compares two prices, the latest and one from period bars ago. The slope uses every bar in the window, so a single unusual bar at either end moves it less.
Why does it start on the second bar?
Two points are enough to fit a line, so the slope appears as soon as two values exist and uses the full window once period bars have passed.