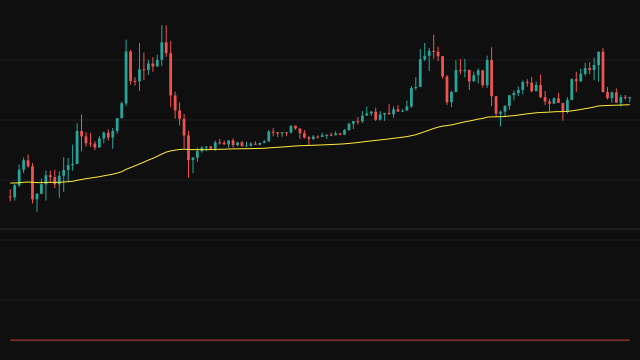
Mean Absolute Error treats an exponential moving average as a forecast of price and measures how wrong it has been. The average is taken over Period bars and seeded with the simple average of its first Period values, so it has no value through the warmup. On every bar the study takes the absolute gap between the source and the average.
Those gaps are averaged over the last Period bars, counting only the bars that carry a gap, so the reading begins on the first bar where the average exists and its window widens until it is full. The result is in the same units as price.
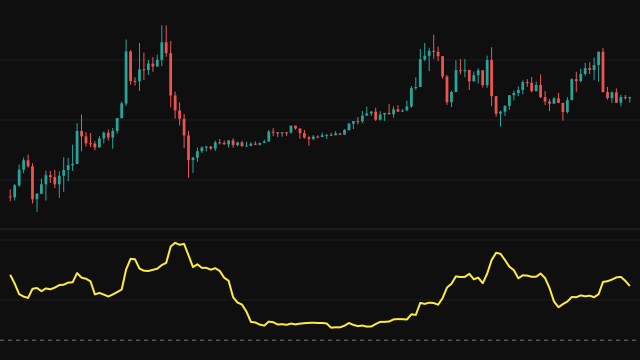
The error is plotted as a shaded area in its own pane, and the reference average is drawn on the price chart.
How to read Mean Absolute Error (MAE)
Read the value as the typical distance, in price units, between price and its average over the recent past. A rising reading means price has been moving further from its average, which happens in strong trends and in volatile stretches. A falling reading means price has settled close to its average.
Because it is measured in price units, the reading grows with the price level and is not comparable between instruments at very different prices. For a scale-free version, use the percentage forms such as MAPE.
Settings
- Source
- The price series measured against its own average. The close by default.
- Period
- The length of the reference EMA and of the window the error is averaged over.
Frequently asked questions
What does the EMA on the price chart have to do with the pane?
It is the forecast being scored. The pane shows the average distance between price and that line over the last Period bars.
How is MAE different from MSE?
MAE averages the absolute gaps, so it is in price units and treats every miss in proportion to its size. MSE squares the gaps first, so large misses count far more.
Why is there nothing for the first bars?
The EMA is seeded from a simple average of its first Period values, so neither the average nor the error exists before the chart has Period bars.