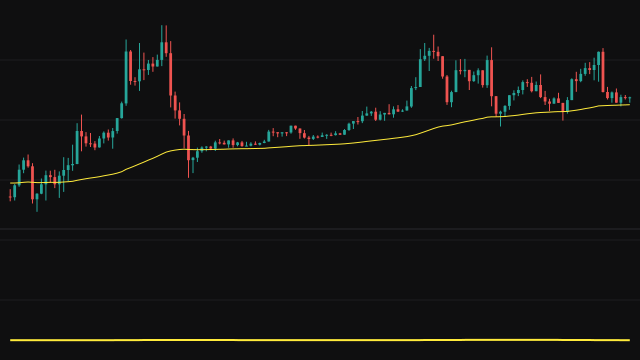
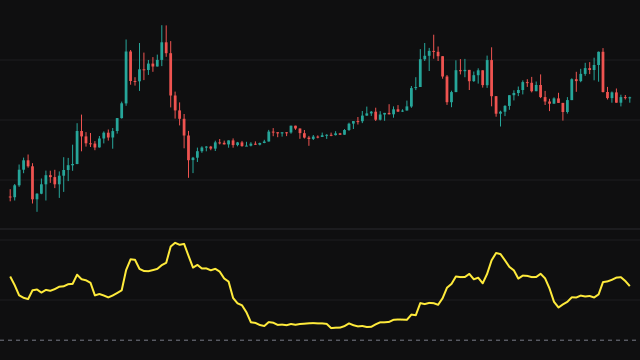
Mean Arctangent Absolute Percentage Error compares an actual series (the close by default) with a predicted series (the open by default). On every bar it divides the absolute gap between them by the absolute actual value, then takes the arctangent of that ratio. The study plots the simple average of those values over the last Length bars.
The arctangent is what sets it apart from a plain percentage error. A ratio near zero passes through almost unchanged, but a very large ratio is squeezed towards pi/2, about 1.571, so no single bar can push the average without limit. When the actual value is effectively zero the bar counts as the largest possible error, pi/2. An absent value on either series is read as zero.
The pane shows a dashed zero line and a dashed line at pi/2, the ceiling of the reading. The axis carries a percent sign, but the values are radians, not scaled by 100.
How to read Mean Arctangent Absolute Percentage Error
The line sits between zero and pi/2. Zero means the predicted series matched the actual one on every bar of the window. For small errors the value is close to the plain ratio, so a reading of 0.002 means the two series were typically about 0.2 percent apart.
With the default inputs it measures how large the bar body is relative to price, smoothed over the window. Rising readings mean bars have been opening further from where they close. The line has no value until Length bars have passed.
Settings
- Length
- How many bars the arctangent errors are averaged over. A longer window gives a smoother line.
- Actual
- The series treated as the outcome and used as the base of the percentage. The close by default.
- Predicted
- The series treated as the forecast of the actual series. The open by default.
Frequently asked questions
Why use the arctangent?
A plain percentage error explodes when the actual value is near zero. The arctangent bounds each bar's error at pi/2, so the average stays finite and readable.
Is the value a percentage?
The axis shows a percent sign, but the numbers are not multiplied by 100. For small errors the value is the error as a fraction, so 0.01 means about one percent.
What is the upper dashed line?
It marks pi/2, the largest value any bar can contribute. A bar reaches it only when its actual value is effectively zero; a very large error brings a bar close to it without reaching it. The average touches the line only if every bar in the window did so.