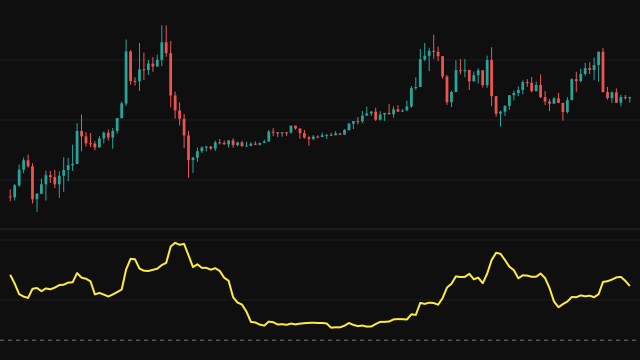
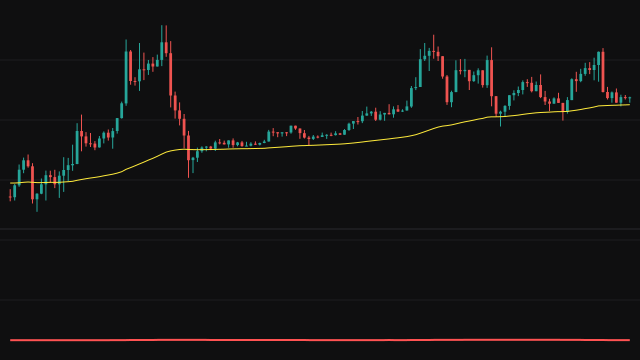
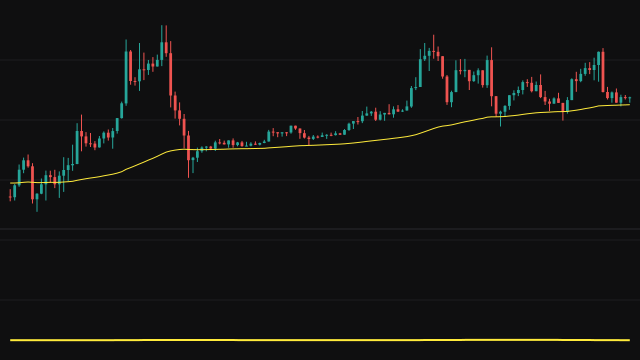
Log-Cosh Loss measures how far one price series sits from another, treated as a forecast. On every bar it takes the gap between the actual series (the close by default) and the predicted series (the open by default) and passes it through log(cosh(x)), the natural logarithm of the hyperbolic cosine of the gap. The study then plots the simple average of that loss over the last Length bars.
The shape of log(cosh(x)) is what makes it useful. For a small gap it is close to half the squared gap, so it behaves like a squared error and rewards small, steady misses. For a large gap it grows like the absolute gap minus log(2), so a single outlier adds to the average in proportion to its size rather than to its square. Beyond a gap of 20 the study uses that straight-line form directly, so a very large gap cannot overflow the exponential.
An absent value on either series is read as zero, and the line has no value until the window has filled.
How to read Log-Cosh Loss
The line is never negative, and zero means the two series agreed on every bar of the window. A rising line means the gap between actual and predicted has been widening; a falling one means they have been converging. With the default inputs the gap is the bar body. Where bodies are many price units wide, the line reads close to the average body less about 0.69; where they are a fraction of a unit, it reads closer to half the average squared body.
The value is in squared price units for small gaps and price units for large ones, so it is not comparable across instruments with very different prices. Compare it with its own history rather than with a fixed threshold.
Settings
- Length
- How many bars the loss is averaged over. A longer window gives a smoother, slower line.
- Actual
- The series treated as the outcome. The close by default.
- Predicted
- The series treated as the forecast of the actual series. The open by default.
Frequently asked questions
Why use log-cosh instead of a squared error?
A squared error lets one large miss dominate the average. Log-cosh behaves like a squared error for small misses but grows only linearly for large ones, so the average reflects the typical miss more than the worst one.
What does it measure with the default inputs?
With close as actual and open as predicted, the gap is the bar's body, so the line is a smoothed measure of how far price travels from open to close.
Why is the line empty at the start of the chart?
It is a simple average over the last Length bars, so it has no value until that many bars have passed.