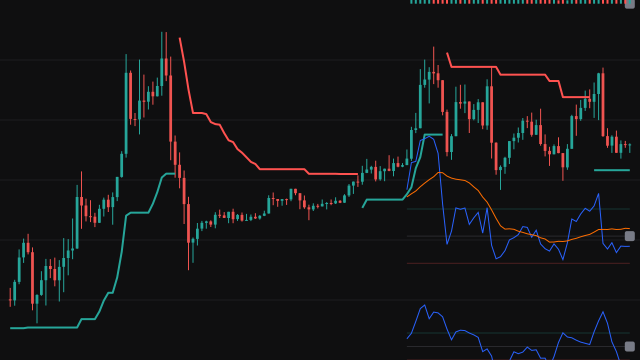
Options Context grades the intraday backdrop on one scale. Six components are each scored from -100 (strongly bearish) to +100 (strongly bullish): trend (the gap and slope of a fast and a slow EMA, in ATR), structure (the close against the session VWAP, the session open and the opening range), momentum (a volatility-normalized log return, its recent change and RSI), participation (where the bar closed and its one-bar return, weighted by relative volume), persistence (how consistently recent regular-session bars closed on one side of VWAP, closed up or down from the previous close, and had the fast EMA on one side of the slow EMA) and the higher timeframes.
Every distance is divided by ATR and passed through a soft saturation, x / (1 + |x|), so no single reading can run away. Relative volume compares each regular-session bar with the same slot of the previous sessions, both for the bar alone and for the volume so far today. The 1H, 4H, daily and weekly readings are folded from the chart's own bars, with intraday buckets anchored to the first bar of each day, and every chart bar reads the last closed higher-timeframe bar, so a reading never changes after the fact.
Context Direction is the weighted mean of the components that exist on the bar. Confidence, from 0 to 100, is a weighted blend of four things: how strongly and how consistently the components agree, the volume intensity behind the participation score, a volatility term that is highest when the volatility reading sits near 65, and the size of the persistence score. Direction is then latched into seven regimes, from strong bear to strong bull, with hysteresis: a regime is held on a weaker score than the one that entered it, so it does not flip back and forth around a threshold. The regime colours the line and shades the background.
How to read Options Context
Read the line as a bias, not a signal. Above +20 the context leans bullish, above +45 it is bullish and above +75 strongly so; the same levels below zero read bearish. The Confidence line says how much to trust that bias: below 35 the components disagree or volume is thin, and the dashboard's Levels Bias then reads LOW CONVICTION. With confidence of 35 or more, Levels Bias reads PREFER SUPPORT at +45 and above (SUPPORT LEAN from +20), PREFER RESISTANCE at -45 and below (RESISTANCE LEAN from -20) and TWO-SIDED in between, which is the side of the market the context favours working from.
The columns show relative volume scaled to the display cap, tinted by whether participation was buying or selling. Structure, participation and persistence only exist inside the regular session, so outside it the blend rests on trend, momentum and the higher timeframes. The opening range only counts on charts whose bars are no longer than the range. The score describes the latest bars; it does not forecast, and on a market that trades around the clock the session you choose decides what counts as the open.
Settings
- Session timezone
- The IANA zone the regular session, the day boundaries and the week boundaries are read in, such as America/New_York or Asia/Kolkata. A blank field reads New York time; a name that is not a timezone stops the script with an error.
- Regular session
- The regular session as two HHMM clock times joined by a hyphen, on the wall clock of the session timezone. An end before the start crosses midnight. An unreadable value falls back to 0930-1600.
- Monday-Friday only
- When on, only Monday to Friday bars count as regular-session bars. Turn it off for an instrument that also trades at the weekend.
- Opening-range minutes
- How long the opening range lasts from the first regular-session bar. The range is ignored when a chart bar is longer than this.
- ATR length
- The average true range that every distance in the trend, structure and momentum scores is measured in.
- Fast EMA
- Length of the fast exponential average used by the trend score, the persistence score and the legacy vote.
- Slow EMA
- Length of the slow exponential average the fast one is compared with.
- Slope lookback
- How many bars back the slope of each average is measured over.
- EMA spread scale (ATR)
- The gap between the two averages, in ATR, that scores about half way to the extreme. Larger values make the trend score less sensitive.
- EMA slope scale (ATR)
- The slope of an average, in ATR, that scores about half way to the extreme.
- RTH VWAP source
- The price the session VWAP is built from.
- VWAP displacement scale (ATR)
- The distance from the session VWAP, in ATR, that scores about half way to the extreme in the structure score.
- Opening-range break scale (ATR)
- How far past the opening range, in ATR, a close must sit before the break score approaches its extreme.
- RTH-open displacement scale (ATR)
- The distance from the session open, in ATR, that scores about half way to the extreme.
- RSI source
- The price the RSI in the momentum score is computed on.
- RSI length
- Length of the RSI on the chart, and of the RSI inside every higher-timeframe reading.
- Normalized-return lookback
- How many bars back the log return in the momentum score is measured over.
- Normalized-return scale
- The volatility-normalized return that scores about half way to the extreme. Larger values damp the momentum score.
- Momentum-change lookback
- How many bars back the change in the return score is measured over.
- Momentum-change scale
- The change in the return score that scores about half way to the extreme.
- RVOL historical days
- How many earlier sessions the relative volume compares each bar with, slot by slot.
- Directional-return scale (ATR)
- The one-bar return, in ATR terms, that counts about half way to a full directional push in the participation score.
- RVOL intensity scale
- How quickly volume above normal turns into participation intensity. Larger values need more volume for the same intensity.
- High RVOL threshold
- Relative volume at or above this is high: it casts a legacy vote, is marked in the dashboard and can raise the aligned volume alert.
- Extreme RVOL threshold
- Relative volume at or above this is labelled extreme in the dashboard.
- RVOL display cap
- The relative volume that fills a column to 100. Higher values are drawn at 100.
- Persistence bars
- How many bars the persistence score averages its three side votes over.
- Short ATR length
- The fast average true range in the volatility ratio.
- Long ATR length
- The slow average true range the fast one is divided by.
- Volatility history
- How many bars of the volatility ratio its mean and standard deviation are taken over.
- Volatility z-score scale
- The z-score that moves the volatility reading about half way from 50 to its extreme.
- Include HTF trend in Context
- When on, the higher-timeframe composite joins the blend with weight 0.15 and the local weights are scaled to 85 percent.
- Show 1H / 4H / 1D / 1W states
- Adds the two rows with each higher timeframe's score and state to the detailed dashboard.
- HTF fast EMA
- Length of the fast average on each folded higher timeframe.
- HTF slow EMA
- Length of the slow average on each folded higher timeframe. A daily or weekly reading needs this many closed days or weeks before it appears.
- HTF ATR length
- The average true range each higher timeframe's distances are measured in.
- HTF EMA slope bars
- How many higher-timeframe bars back the slope of each average is measured over.
- HTF recent-path bars
- How many higher-timeframe bars the path return and path efficiency look back over.
- HTF persistence bars
- How many higher-timeframe bars the balance of closes above and below the fast average is taken over.
- HTF EMA spread scale (ATR)
- The gap between the higher-timeframe averages, in ATR, that scores about half way to the extreme.
- HTF EMA slope scale (ATR/bar)
- The slope per bar, in ATR, that scores about half way to the extreme on a higher timeframe.
- HTF path-return scale
- The path return, in ATR times the square root of the path length, that scores about half way to the extreme.
- HTF directional threshold
- How far from zero a higher-timeframe score must be to count as bullish or bearish in the dashboard's breadth count.
- Show Context Direction
- Draws the Context Direction line and its shading to zero.
- Show Context Confidence
- Draws the Confidence line.
- Show RVOL columns
- Draws the relative volume columns, coloured by the sign of the participation score.
- Show RSI momentum score
- Draws the RSI part of the momentum score on the same -100 to 100 scale.
- Show HTF composite
- Draws the weighted higher-timeframe composite.
- Subtle regime background
- Shades each bar's background in the colour of the latched regime.
- Regime background transparency
- How transparent the regime shading is, from 85 to 100. At 100 nothing is shaded.
- Show dashboard
- Shows the table of readings for the newest bar.
- Dashboard mode
- Detailed lists every component, the higher timeframes, volume, volatility and session state. Compact keeps the summary, HTF, RVOL and volatility rows.
- Dashboard position
- The corner of the pane the dashboard sits in.
- Dashboard text size
- Kept so saved settings load. The table is drawn at the chart's own text size, so it changes nothing on this chart.
- Enable alert conditions
- Turns all eight alerts on or off.
- High-confidence direction threshold
- How far from zero Context Direction must be for the high-confidence alert.
- High-confidence confidence threshold
- The confidence the high-confidence alert also requires.
- Strong-regime failure window (bars)
- How many bars after entering a strong regime a fall back through 20 (or a rise back through -20) counts as a failure alert.
- Show v0.1 binary-score comparison
- Draws the older five-vote score, times 20, for comparison with the graded blend.
Frequently asked questions
Why are the daily and weekly readings blank on my chart?
Each higher timeframe needs as many closed buckets as the HTF slow EMA length (50 by default) before it has a reading, so on an intraday chart with a few months of history the weekly reading, and sometimes the daily, stays empty. The composite uses whichever timeframes have a reading.
Why does the line sometimes rest on fewer components?
Structure, participation and persistence are only computed on regular-session bars, and participation also needs earlier sessions to compare volume with. A missing component drops out of the weighted mean and the remaining weights are rescaled.
What does the regime add over the line itself?
The regime is a latch with hysteresis. A strong bull state entered at 75 is kept until the score falls below 68, and a bull state entered at 45 is kept down to 38, so the colour and the background change on a real shift rather than on every wiggle around a threshold.
Which session should I set for an instrument that trades around the clock?
Set the hours you treat as the main session, in the zone you care about. The session decides the VWAP reset, the opening range, the relative-volume slots and where persistence counts, so a different window gives a different reading.