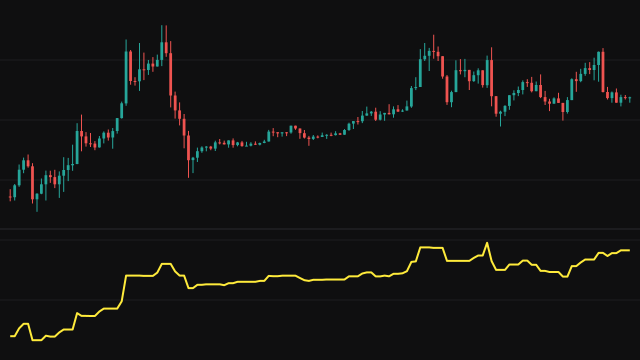
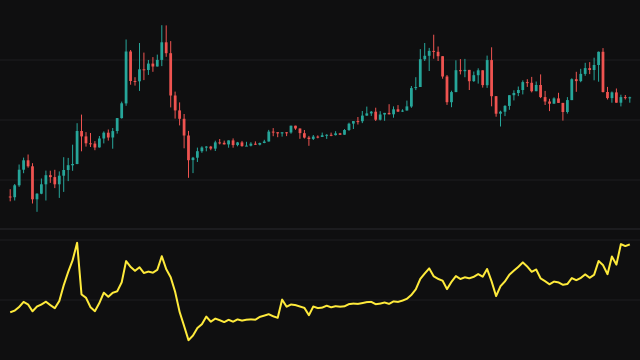
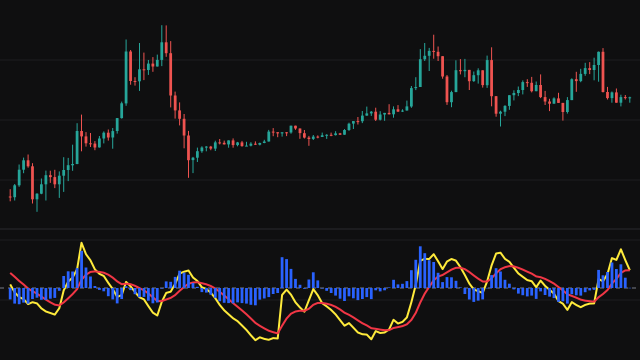
Price Volume Divergence compares two rates of change. The price rate of change is the percentage move in close over Price Period bars, and the volume rate of change is the percentage move in volume over Volume Period bars. Volume is floored at 1, so the study still draws on a series without volume. Until a period has passed, the change is measured from the first bar, and on the first bar itself it is zero.
Each rate of change is reduced to its direction: +1, -1 or 0. The raw value is the price direction times the opposite of the volume direction, times the sum of the two absolute rates of change. So it is positive when price and volume moved in opposite directions, negative when they moved together, and zero when either was unchanged. The raw value is smoothed with a simple mean over Smoothing Period bars, which covers however many bars have arrived until the window fills.
How to read Price Volume Divergence (PVD)
A positive reading means price and volume have been pulling apart: price rising on falling volume, or falling on rising volume. A negative reading means they agree. The further from zero, the larger the combined moves behind the reading.
A rise into positive territory during an advance suggests the move is happening on shrinking volume, which some traders read as a weakening trend. The line is noisy with short periods and can swing sharply on a single bar with an unusual volume change; a longer Smoothing Period calms it.
Settings
- Price Period
- The number of bars over which the percentage change in close is measured.
- Volume Period
- The number of bars over which the percentage change in volume is measured.
- Divergence Threshold
- Kept for reference only. Changing it does not change the plotted line.
- Smoothing Period
- The number of bars in the simple mean applied to the raw divergence. A longer period gives a calmer line.
Frequently asked questions
Does a positive reading mean price will fall?
No. It means price and volume moved in opposite directions over the chosen periods: price up on falling volume, or price down on rising volume. It describes what happened, not what comes next.
What does the Divergence Threshold do?
Nothing to the line. The setting is declared but not used in the calculation, so moving it leaves the plot unchanged.
Why are the early values measured from the first bar?
Until a full period has passed there is no bar that far back, so the rate of change is taken from the first bar instead, and the first bar itself reads zero.