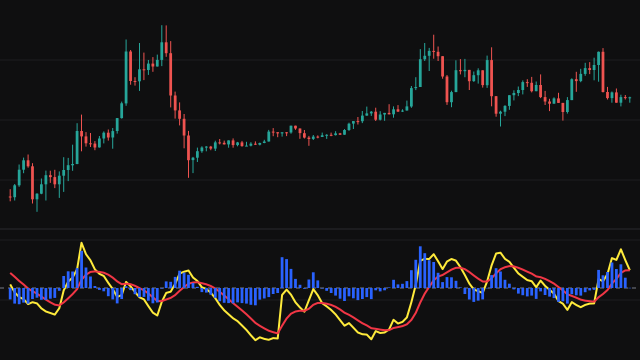
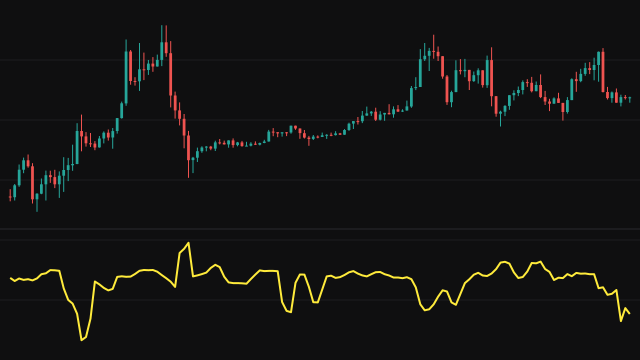
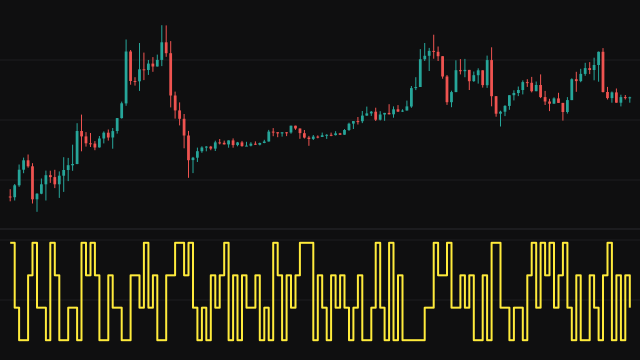
The Positive Volume Index tracks what price does on busier bars. It starts at 100. On each bar whose volume is higher than the previous bar's volume, the index is multiplied by this bar's price divided by the previous bar's price, so it takes on that bar's percentage change. On every other bar, when volume fell or stayed the same, the index holds flat.
The first bar has no previous bar, so it holds at 100. A bar is skipped as well when the previous price is zero or the previous volume is not above zero, which avoids dividing by nothing. The price followed is the Price Source setting, the close by default.
How to read Positive Volume Index (PVI)
Because the index only moves on bars where volume rose, it shows the trend made when activity picked up. A rising index means price has tended to advance on rising volume; a falling one means rising volume has come with declines. Many traders compare the index with a long moving average of itself to judge the trend.
The level is the compounded price change on the busier bars since the start at 100, not a price, so read the direction and the slope. Pair it with the Negative Volume Index to compare how price behaves on busy bars against quiet ones.
Settings
- Price Source
- The price whose percentage change the index takes on the qualifying bars, the close by default.
Frequently asked questions
Why does the line stay flat for stretches?
It only moves on bars whose volume is higher than the bar before. Through a run of falling volume it holds its last value.
How does it relate to the Negative Volume Index?
They split the bars between them: this index moves on bars where volume rose, the negative index on bars where it fell. Bars with unchanged volume move neither.