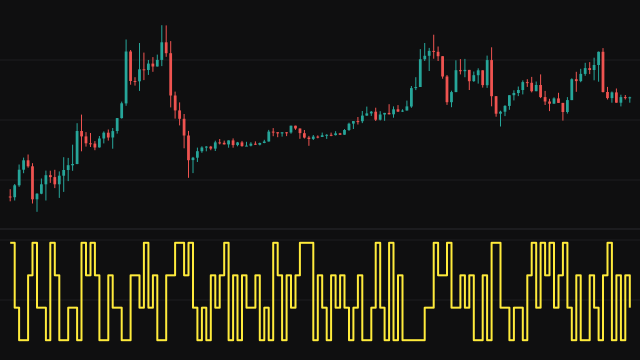
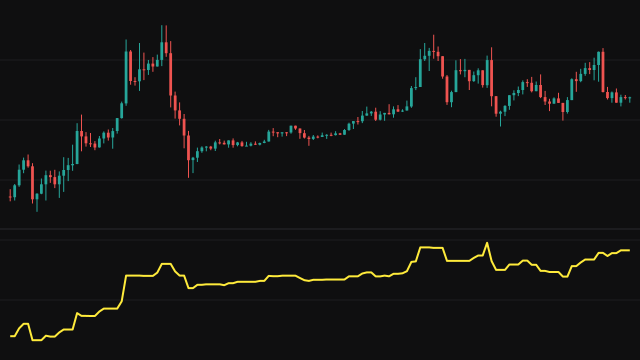
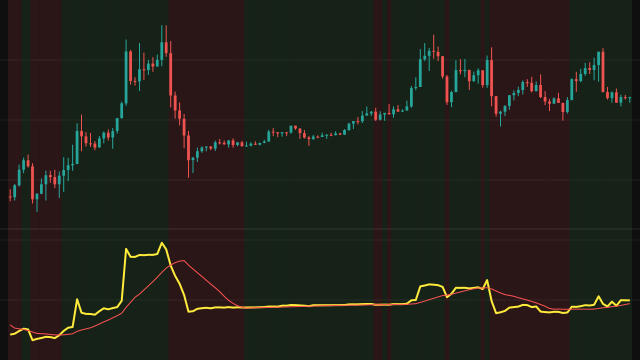
The Percentage Volume Oscillator measures whether volume is expanding or contracting. It takes a fast and a slow exponential mean of each bar's volume and expresses their difference as a percentage of the slow mean: (fast - slow) / slow x 100. A signal line is an exponential mean of that percentage, and the histogram is the oscillator minus the signal.
Each mean starts from zero and, while that start still matters, is divided by one minus its decayed seed weight, so the lines read true from the first bar. The correction ends once the slowest of the three seed weights has fallen to 1e-10. The slow period has to be longer than the fast one: when it is set equal to or shorter than the fast period, it is held one bar longer than the fast period instead.
How to read Percentage Volume Oscillator (PVO)
Above zero, recent volume is running above its longer average, so participation is expanding; below zero, it is contracting. The size of the reading is the percentage gap, so +20 means the fast mean is 20 percent above the slow one.
The oscillator says nothing about price direction on its own. It is usually read alongside price: a breakout with the oscillator rising above zero has volume behind it, while one with the oscillator below zero is happening on thin trade. Crossings of the signal line, where the histogram changes sign, mark turns in the volume trend.
Settings
- Fast Period
- The length of the fast exponential mean of volume. A shorter value reacts to each surge in volume more quickly.
- Slow Period
- The length of the slow exponential mean used as the baseline. If it is not longer than the fast period, it is held one bar longer than the fast period.
- Signal Period
- The length of the exponential mean of the oscillator that forms the signal line and the histogram.
Frequently asked questions
What happens if I set the slow period below the fast period?
The study uses a slow period one bar longer than the fast period instead, so the oscillator is never drawn inverted.
Does it show whether buyers or sellers are in control?
No. It only measures volume against its own average. Read price to see which side the volume is on.