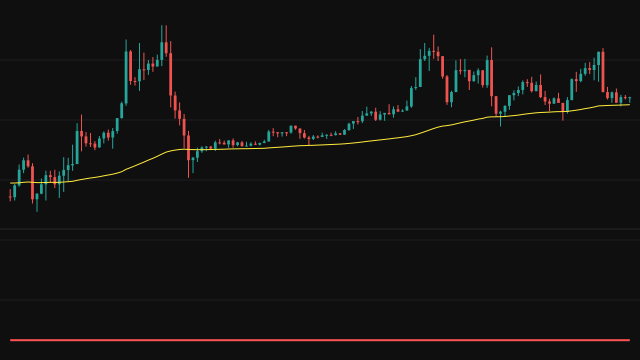
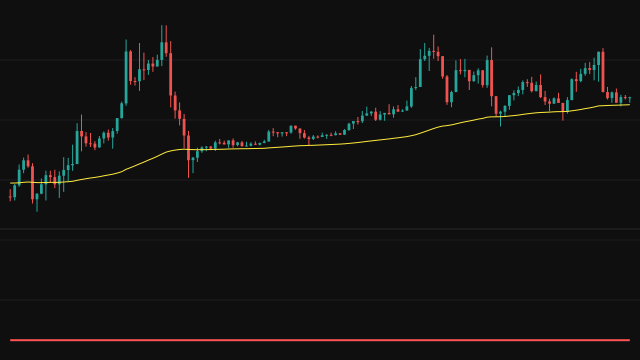
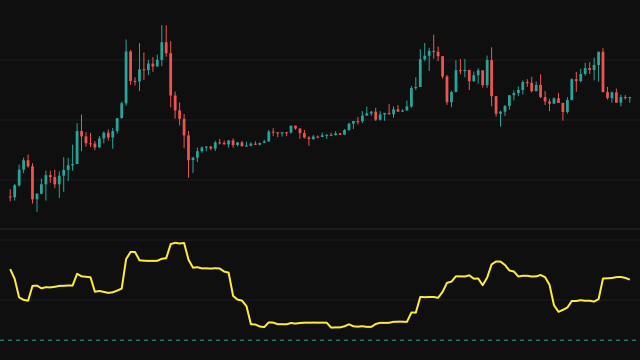
The R squared coefficient of determination here measures how well an exponential moving average of the source explains the source's own movement. The exponential average uses Period as its length and starts from the simple average of its first Period values, so it has no value through that warmup. The reference for comparison is the mean of the source over the last Period bars, including this one; before that many bars have passed it is the mean of every bar so far.
On every bar the study squares the gap between the source and the exponential average (the residual) and squares the gap between the source and the window mean (the total variation). Each is totalled over the last Period bars, counting only the bars that carry a value. The score is one minus the residual total divided by the variation total, and a window with no variation reads 1. The exponential average is drawn on the price chart.
How to read R² Coefficient of Determination (RSQUARED)
A score near 1 means the exponential average follows price closely relative to how much price has moved around its mean, which is typical of a steady trend. A score near 0 means the average explains no more than the flat mean would, and a negative score means it does worse, which happens in choppy markets where the average lags every turn.
The score has no value until the exponential average starts on bar Period minus one. It is a measure of fit, not of direction: a strong downtrend scores as high as a strong uptrend.
Settings
- Source
- The series being explained by its own exponential average.
- Period
- The length of the exponential average and of the window used for the mean and both totals.
Frequently asked questions
Can the score be negative?
Yes. If the exponential average misses price by more, in squared terms, than the flat mean of the window does, the ratio passes 1 and the score drops below zero.
How does it relate to the Relative Squared Error?
It is one minus that ratio over the same window and the same average, so a high score here is a low reading there.
Does a high score mean price will keep trending?
No. It describes how well the average has fitted the bars in the window. It says nothing about the next bar.