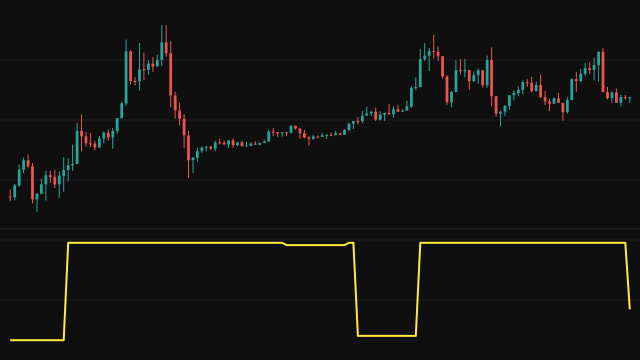
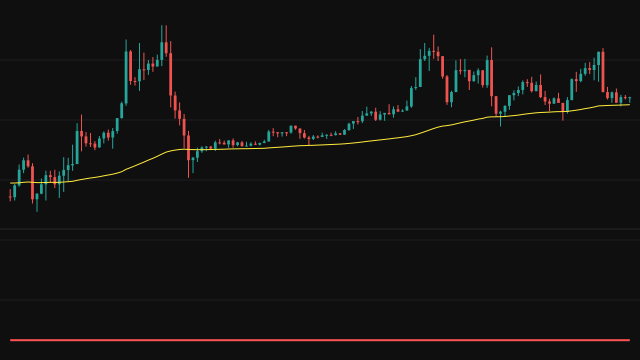
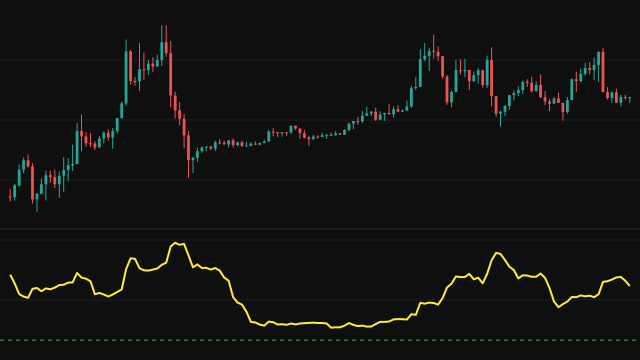
Theil's U Statistic compares a predicted series with an actual series over a rolling window and scales the error so the reading does not depend on the price level. On every bar it squares the forecast error (predicted minus actual), squares the actual value and squares the predicted value. Each of the three is totalled over the last Length bars.
The statistic is the square root of the error total divided by the square root of the actual total plus the predicted total. A window where both series are effectively zero has nothing to scale by and reads 0. An absent value on either side is read as zero before squaring.
How to read Theil's U Statistic (TheilU)
Zero means the predicted series matched the actual one on every bar of the window. The further the reading climbs toward 1, the larger the misses are compared with the size of the series themselves. The dashed line at 1 marks a forecast that is no better than a naive one, and the line at 0 marks a perfect forecast.
On price series the two values are large and close together, so readings sit very near zero and the useful information is in the changes: a rising line means the predicted series is drifting further from the actual one. The line has no value until Length bars have passed.
Settings
- Length
- How many bars the squared values are totalled over. A longer window gives a smoother, slower line.
- Actual
- The series treated as the truth.
- Predicted
- The series treated as the forecast that is scored against the actual one.
Frequently asked questions
Why are the readings so close to zero on a price chart?
The denominator is the size of the two series themselves. On an instrument trading in the thousands, a miss of a few points is tiny by comparison, so the ratio is small. Compare readings over time rather than against 1.
Does the price level change the reading?
No. Both the error and the scale are in the same units, so doubling every price leaves the statistic unchanged.
What are the two dashed lines?
The line at 0 is a perfect forecast and the line at 1 is the level of a naive forecast that adds no information.