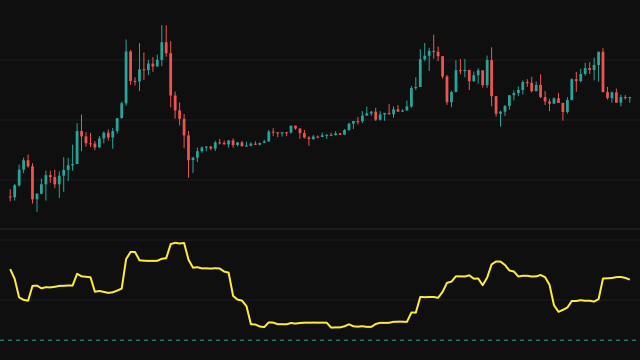
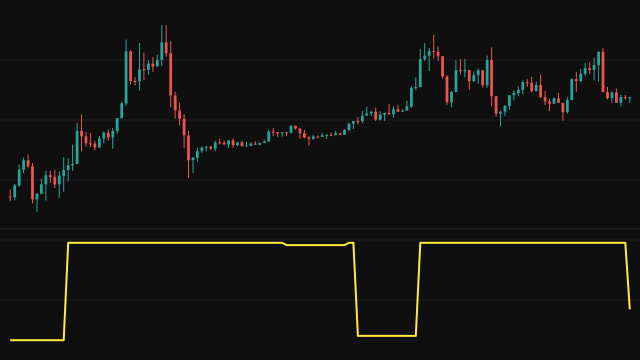
Symmetric Mean Absolute Percentage Error (SMAPE) measures how far a source series runs from its own exponential moving average, in percent. The average uses Period as its length and starts from the simple average of its first Period values. On every bar the symmetric error is 200 times the absolute gap between the source and the average, divided by the sum of their absolute values. Dividing by both sides rather than by one keeps the score between 0 and 200 and makes a miss above count the same as a miss below.
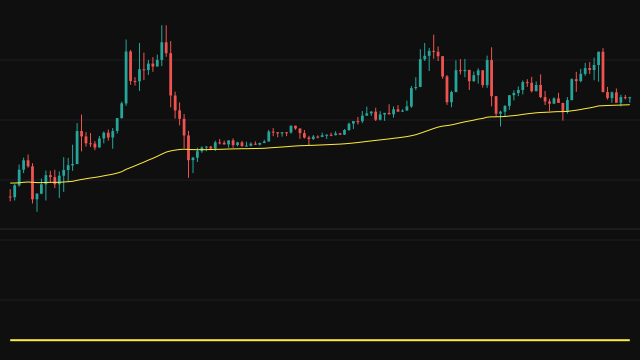
While the average has no value yet, the error for that bar counts as zero, and those zeros do enter the average. The plotted value is the mean of the symmetric errors over the last Period bars, or over every bar so far while fewer than Period have passed. The exponential average itself is drawn on the price chart.
How to read Symmetric Mean Absolute %Error (SMAPE)
Read the pane as the typical percentage distance between price and its trend line. A reading of 1 means price has been about one percent from its exponential average on an average bar of the window. A rising line means price is stretching further from the average; a falling one means it is settling back toward it.
The early part of the line is pulled toward zero by the warmup bars, which count as zero error, so do not read the first Period or so bars as a quiet market. The score shows the size of the gap, not its direction.
Settings
- Source
- The series compared with its own exponential average.
- Period
- The length of the exponential average and of the window the symmetric errors are averaged over (the window is capped at 4000 bars).
Frequently asked questions
Why does the line start at zero and climb?
Before the exponential average has a value each bar counts as zero error, and those zeros sit in the window. As real errors replace them, the line rises to its true level.
Why is it called symmetric?
The gap is divided by the sum of both magnitudes rather than by the actual value alone, so swapping price and the average gives the same score and the reading cannot exceed 200.
What is the forecast here?
The exponential moving average of the source with the same length as the window. The study treats the average as a forecast of price and scores how far price strays from it.