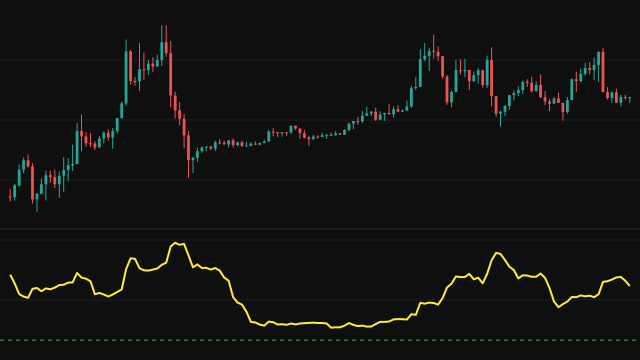
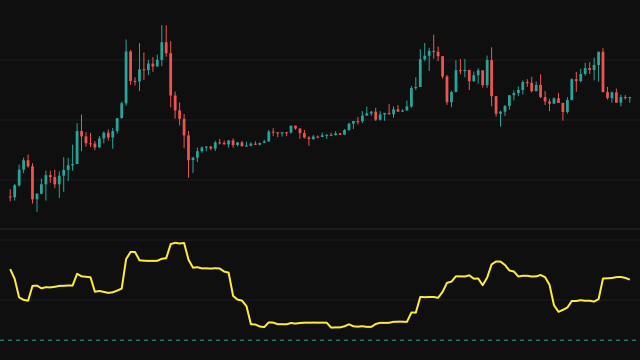
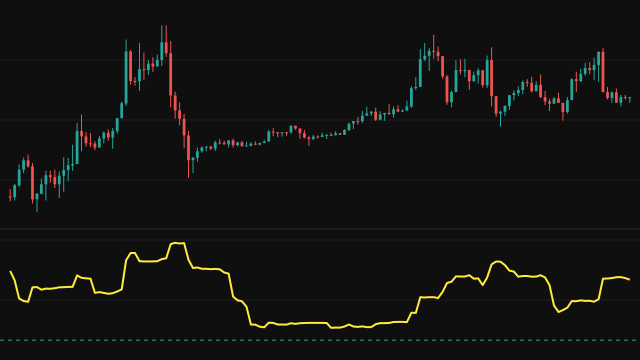
Tukey's Biweight Loss scores the gap between an actual series and a predicted series with a loss that stops growing once the miss is large enough. On every bar the error is the actual value minus the predicted value. If the size of the error is larger than the threshold c, the bar costs a fixed c squared over six. Otherwise the error is divided by c, that ratio is squared and taken from one, the result is cubed and taken from one again, and the answer is multiplied by c squared over six.
The loss rises smoothly from zero for a perfect forecast and flattens out at its ceiling as the error approaches c, so every miss beyond the threshold counts the same. The study plots the simple average of this loss over the last Length bars. An absent value on either side is read as zero.
How to read Tukey's Biweight Loss (TukeyBiweight)
A lower line means more bars had small misses. Because each bar is capped, the line can never exceed c squared over six, and a reading near that ceiling says most bars in the window missed by more than c. A few extreme bars cannot push the line far, which is the point of the measure: it reports how often the forecast was close rather than how badly it failed at its worst.
The threshold has to be in the same price units as the error. With a threshold far below the size of a normal miss, almost every bar sits at the ceiling and the line goes flat. The line has no value for the first Length minus one bars.
Settings
- Length
- How many bars the loss is averaged over. A longer window gives a smoother, slower line.
- Threshold c
- The error size beyond which a miss stops costing more. A larger value lets bigger misses count in full and raises the ceiling of the line.
- Actual
- The series treated as the truth.
- Predicted
- The series treated as the forecast that is scored against the actual one.
Frequently asked questions
Why does the line go flat at a fixed value?
Every bar whose error is larger than c costs exactly c squared over six. When all the bars in the window miss by more than c, the average sits at that ceiling. Raise c to bring the line back into its responsive range.
Where does the default of 4.685 come from?
It is the threshold commonly used for errors measured on a standardised scale. On raw price differences it is only a starting point; set c near the size of a typical miss on your chart.
How is it different from the Pseudo-Huber Loss?
The Pseudo-Huber Loss keeps growing for large errors, roughly in a straight line. The biweight loss stops growing entirely beyond c, so an outlier adds no more than any other large miss.