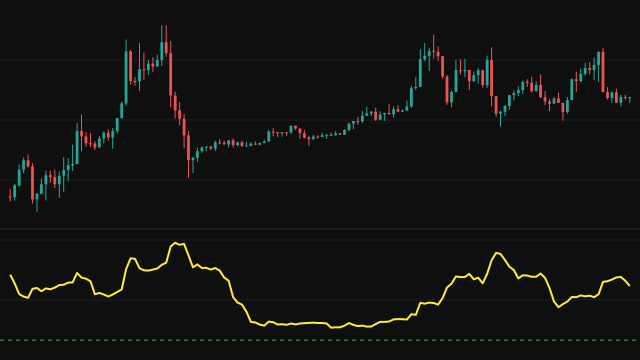
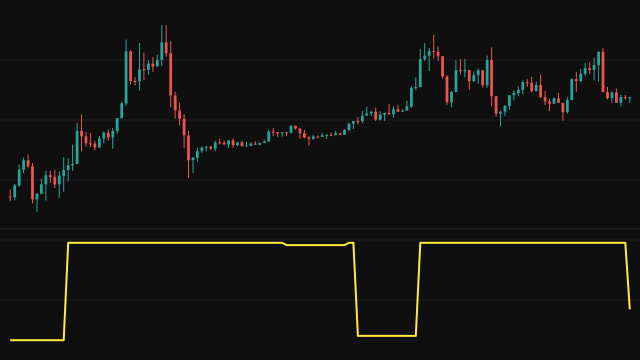
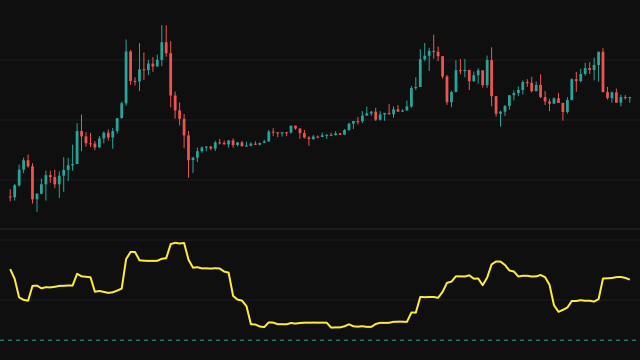
Weighted Root Mean Squared Error measures how far one series sits from another, in the units of the data. On each bar it takes the gap between the Actual series (the close by default) and the Predicted series (the open by default), squares it and multiplies it by the bar's weight.
Over the last length bars it adds up those weighted squared gaps, divides by the sum of the weights and takes the square root. With every weight set to one this is the plain root mean squared error. With volume weighting switched on, each bar weighs as much as the volume it traded, so busy bars dominate the result and quiet bars barely count. A bar with no volume weighs one, a missing price counts as zero, and a window whose weights add up to nothing reads as zero.
How to read Weighted Root Mean Squared Error
The line is always zero or above. Zero, marked by the dashed Perfect level, means the two series agreed exactly over the window. A higher value means a larger typical gap, and because the gaps are squared before they are averaged, a few large misses lift the line more than many small ones.
With the default inputs it reads as the typical size of the bar body, a gauge of how far price travels from open to close. Compare it with itself over time rather than across instruments, since it is measured in price units and scales with the price level.
Settings
- Length
- How many bars the rolling window holds. A longer window gives a steadier line that reacts later.
- Use Volume as Weights
- Weight each bar's squared gap by its volume instead of giving every bar the same weight.
- Actual
- The series treated as the observed value. The close by default.
- Predicted
- The series compared against the actual one. The open by default.
Frequently asked questions
Why does the line start a few bars into the chart?
It needs a full window of length bars before it can report a value, so the first length - 1 bars are left blank rather than drawn from a partial window.
What changes when volume weighting is on?
Bars that traded heavily count for more in the average and quiet bars for less, so the line follows the gaps that formed on busy bars. With it off every bar counts the same and the result is the ordinary root mean squared error.
How is it different from mean absolute error?
The gaps are squared before averaging and the root is taken afterwards, so large gaps weigh more than in an average of absolute gaps. The result is always at least as large as the mean absolute error over the same window.