Weighted Mean Absolute Percentage Error (WMAPE) measures forecast error in percent without dividing bar by bar. On every bar it takes the absolute gap between the actual and the predicted series, and the absolute actual value. Both are totalled over the last Length bars, and the error total is divided by the actual total and multiplied by 100.
Because the division happens once on the window totals, a single bar with a tiny actual value cannot blow the reading up the way it can in a plain mean of percentage errors. Larger bars carry more weight, which is where the name comes from. A window whose actual values are all zero has no scale and reads 0. An absent value on either side is read as zero.
How to read Weighted Mean Absolute Percentage Error
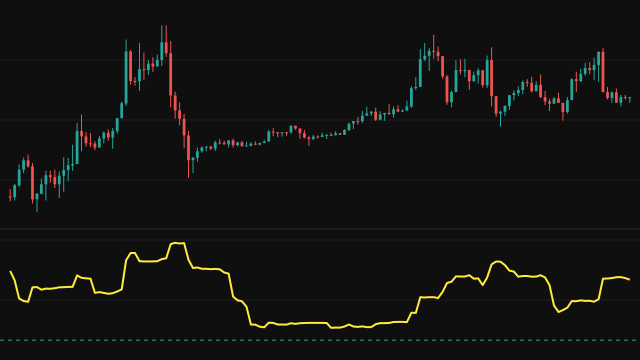
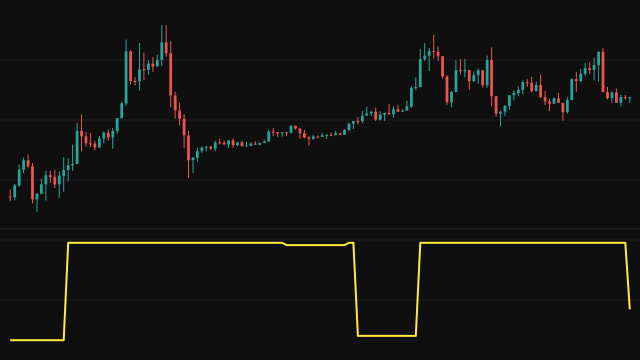
The reading is the share of the actual series that the forecast missed by, in percent. A value of 0.5 means the misses over the window added up to half a percent of the actual values. Lower is better, and the dashed line at 0 marks a perfect forecast. A rising line says the predicted series is drifting further from the actual one.
The line has no value until Length bars have passed. It shows the size of the miss, not its direction, so a forecast that is always too high and one that is always too low can score the same.
Settings
- Length
- How many bars the errors and the actual values are totalled over. A longer window gives a smoother, slower line.
- Actual
- The series treated as the truth. The total error is expressed as a percentage of this series.
- Predicted
- The series treated as the forecast that is scored against the actual one.
Frequently asked questions
How is it different from an ordinary percentage error?
An ordinary percentage error divides each bar by its own actual value and then averages, so one bar with a small actual value can dominate. This one totals first and divides once, so each bar counts in proportion to its size.
What does it show with the default settings?
The actual series is the close and the predicted series is the open, so it reports the total open to close movement over the window as a percentage of the total close.
Why is there no line on the first bars?
The totals need a full window of Length bars before they are complete, so the first reading appears on the bar where that window fills.