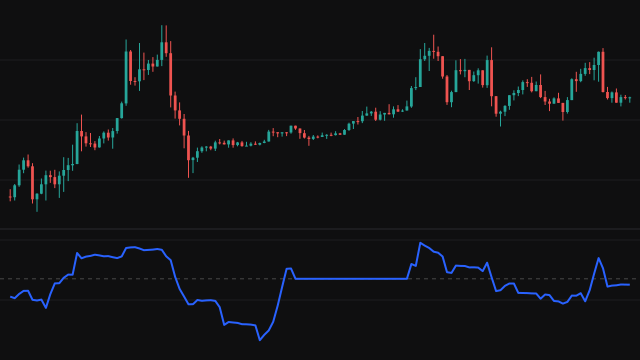
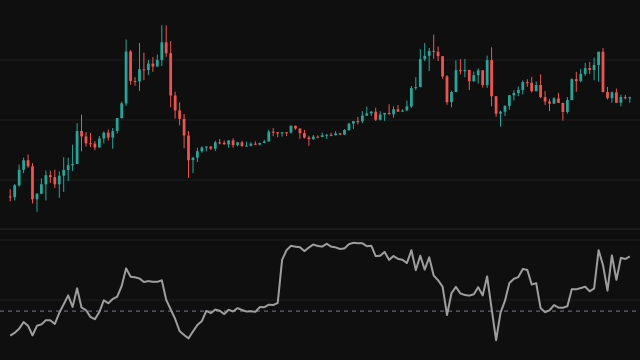
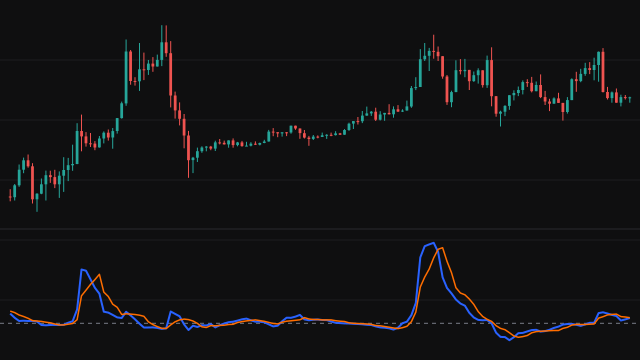
Relative Volume compares how much traded on this bar with how much usually trades. The baseline is the simple average of the volume over the Average Length bars before the current one, and the reading is the current bar's volume divided by that baseline. A reading of 1 is an ordinary bar, 2 is twice the usual volume and 0.5 is half of it.
The current bar is left out of its own baseline on purpose: a single very heavy bar would otherwise raise the average it is measured against and look less unusual than it is. The value is absent until enough earlier bars exist to fill the baseline, and on any bar where the baseline is zero.
The study draws one column per bar in its own pane, a dashed level at 1, and colours a column with the highlight colour when it reaches the Highlight Above multiple.
How to read Relative Volume (RVOL)
Columns above the dashed line at 1 are bars with more activity than usual and columns below it are quieter bars. A highlighted column marks a bar that traded at least the chosen multiple of its baseline, which often comes with a breakout, a news event or the start or end of a sharp move. Pair it with the direction of the bar: heavy volume on a wide up bar reads differently from heavy volume on a bar that closes back where it opened.
Relative volume says how much traded, not who was buying or selling. On instruments whose volume follows a strong time of day pattern, the first bars of a session will often read high simply because sessions open busy.
Settings
- Average Length
- How many earlier bars form the baseline average. A longer baseline is steadier and makes a single surge stand out more.
- Highlight Above
- The multiple of the baseline at or above which a column is drawn in the highlight colour and the alert fires.
- Column Color
- The colour of columns below the highlight multiple.
- Highlight Color
- The colour of columns at or above the highlight multiple.
Frequently asked questions
Why is the current bar not part of the average?
Including it would let a heavy bar raise its own baseline and shrink its reading. Measuring against the bars before it shows the surge at its full size.
What does a reading of 3 mean?
The bar traded three times the average volume of the preceding bars in the baseline.
Why is the first part of the chart empty?
The study needs a full baseline of earlier bars before it can divide by their average, so the first Average Length bars have no value.