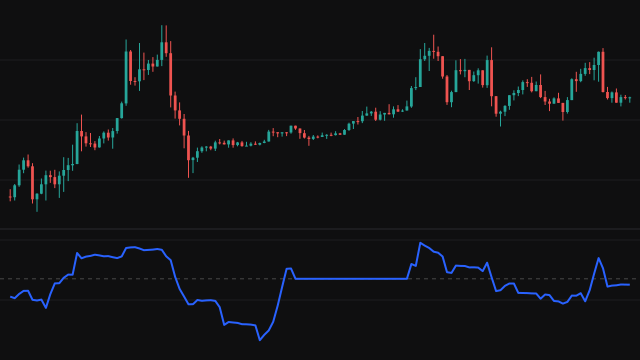
Twiggs Money Flow, from Colin Twiggs, measures buying and selling pressure from volume and the position of the close. Each bar's range is a true range: the true high is the higher of the high and the previous close, and the true low is the lower of the low and the previous close, so an overnight gap counts as part of the bar. The first bar, with no previous close, uses its own high and low.
Each bar's flow is volume times ((close - true low) - (true high - close)) / (true high - true low), which runs from minus the volume at the true low to plus the volume at the true high. A bar with no range carries no flow. The flow and the volume are each smoothed with a Wilder average of 21 bars (weight 1 / 21, seeded with the simple average of the first 21 values), and the money flow is their ratio.
The result moves between -1 and +1 and is drawn as a line, green at or above zero and red below, with a dashed zero line.
How to read Twiggs Money Flow
Above zero, volume has come in on closes near the top of the true range, which is accumulation; below zero, on closes near the bottom, which is distribution. The further from zero, the more one-sided the flow has been.
Traders watch for divergences: price making a new high while the money flow makes a lower high suggests buyers are thinning out, and the reverse near a low. A crossing of zero confirms a change in pressure, but it lags. On instruments with thin or unreliable volume the reading carries little information.
Settings
- Length
- Bars in the Wilder average of the flow and of volume. 21 is the usual value; longer lengths give a smoother, slower line.
Frequently asked questions
How does it differ from the Chaikin Money Flow?
It uses a true range that includes the previous close, so gaps count, and it smooths with a Wilder average instead of summing a fixed window, which avoids jumps when an old bar drops out.
What range can the reading take?
Between -1 and +1. Plus 1 would mean every bar in the average closed at its true high.
Why does the line start later than the price?
The Wilder averages need the first 21 bars to seed, so the first value appears on the 21st bar.