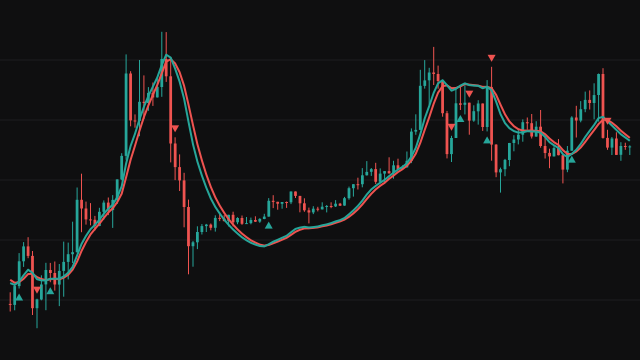
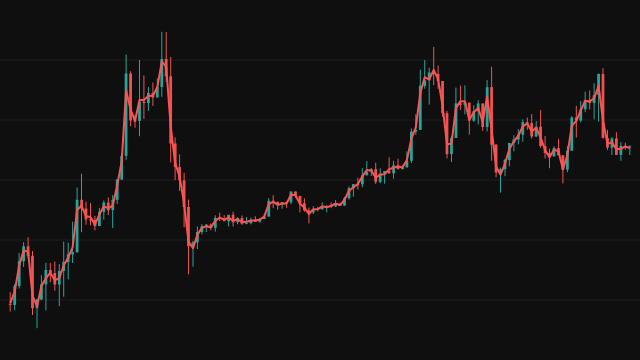
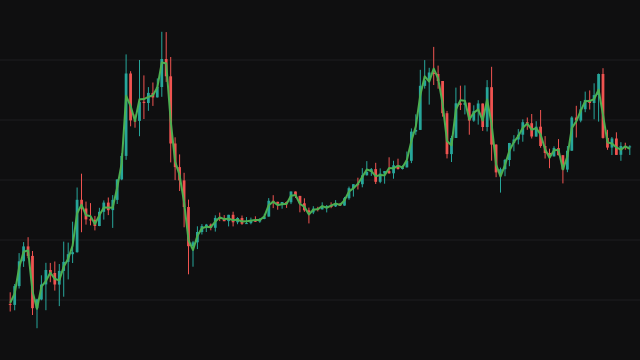
Smoothed Heikin Ashi draws its own candles over the price chart in two passes. First, the bar's open, high, low and close are each smoothed by a 10 bar exponential average. Heikin Ashi candles are then built from those smoothed prices: the candle's close is the mean of the four, its open is the midpoint of the previous candle's open and close, and its wicks stretch to cover the open and close as well as the smoothed high and low.
In the second pass each of the four prices of those candles is smoothed again by another 10 bar exponential average, and the result is what is drawn. Every exponential average starts from the simple average of its first values, so the candles appear after a short warmup. A candle is green when its close is at or above its open and red when it is below.
How to read Smoothed Heikin Ashi
A run of green candles means the smoothed trend is up and a run of red ones that it is down. Because of the double smoothing, the colour changes rarely and late: it is a picture of the trend's direction, not a timing signal. Many traders hold a position while the colour stays the same and look for small bodies and long wicks as a sign the trend is tiring.
The smoothed candles do not show the real prices of any bar, so place orders and stops from the instrument's own candles, which stay visible underneath.
Settings
- First Smoothing
- Bars in the exponential average applied to the bar's own open, high, low and close before the Heikin Ashi candles are built.
- Second Smoothing
- Bars in the exponential average applied to the finished Heikin Ashi candles. Larger values give fewer colour changes and more lag.
Frequently asked questions
How is this different from plain Heikin Ashi?
Plain Heikin Ashi averages the raw prices once. This study smooths the prices before building the candles and smooths the candles again afterwards, so it changes colour far less often and lags more.
Can I trade at the prices these candles show?
No. They are averages, not traded prices. Use the instrument's own candles for entries, exits and stops.
Why are the first candles missing?
Each exponential average needs its first values to start, and the second pass waits for the first, so the candles begin after about the sum of the two lengths.