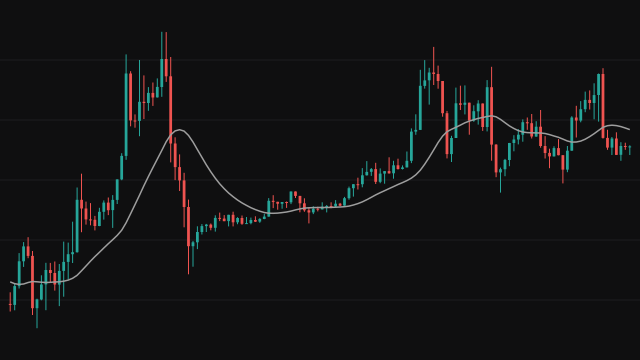
This study follows Sylvain Vervoort's method of reading trend from Heikin Ashi values with averages that lag very little. It first builds a Heikin Ashi open: the midpoint of the previous open and the previous bar's mean price. Its close, in Vervoort's form, is the mean of four values: the bar's mean price, that open, the higher of the high and the open, and the lower of the low and the open.
That close is then given a zero-lag average. A triple exponential average (TEMA) of 55 bars is taken, a second TEMA is taken over the first, and the difference between the two is added back to the first: TEMA1 + (TEMA1 - TEMA2). Adding the difference back cancels much of the delay that smoothing brings. The same zero-lag average of a price source, the typical price by default, gives the second line.
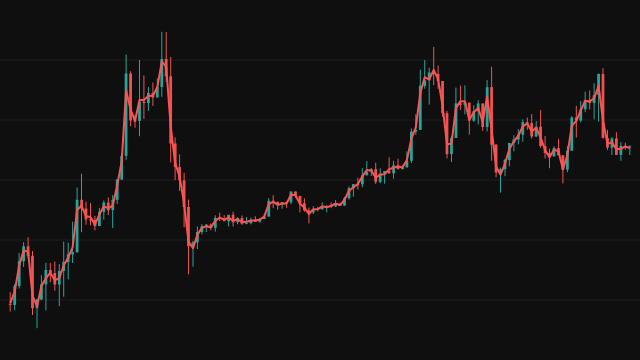
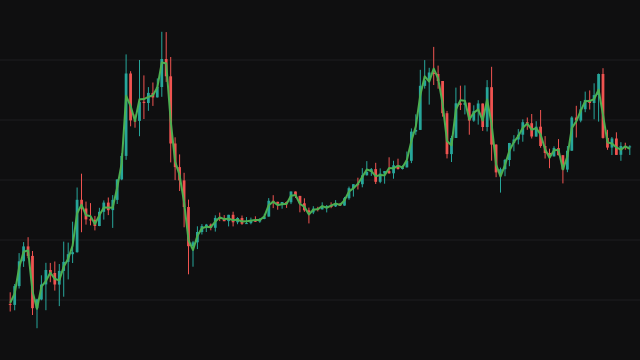
The Heikin Ashi line is drawn in red and the price line in green, with a triangle where the price line crosses the Heikin Ashi line.
How to read Heikin Ashi Zero-Lag Average
When the price line is above the Heikin Ashi line the trend reads as up, and when it is below, as down. An up triangle marks the bar the price line crossed above, and a down triangle the bar it crossed below. Both lines are smooth enough that a crossing usually holds for a while, which makes them useful for staying with a trend rather than catching its first bar.
The lines need roughly six times the average length before they appear. In a sideways market they twist around each other and crossings come in quick pairs, so many traders only act on a crossing that agrees with the longer trend.
Settings
- Average Length
- Bars in every exponential average behind both lines. Shorter values react faster and cross more often; 55 is the published default.
- Price Line Source
- The price series the second zero-lag line is built from. The typical price is the default; the median price is a common alternative.
- Show Crossings
- Draw a triangle on each bar where the price line crosses the Heikin Ashi line. Turn it off to see the two lines alone.
Frequently asked questions
What makes the average zero-lag?
A TEMA of the series lags behind it, and a TEMA of that TEMA lags further. Adding the gap between the two back to the first TEMA moves the line forward by about the delay smoothing added.
Why use the Heikin Ashi close for one line?
The Heikin Ashi close carries part of the previous bars in its open, so its average is steadier than an average of price. The price line reacts sooner, and the crossing of the two marks a change in direction.
Why do the lines take so long to appear?
Each line uses six exponential averages in a chain, three for each TEMA, so with a length of 55 it needs a few hundred bars of history first.