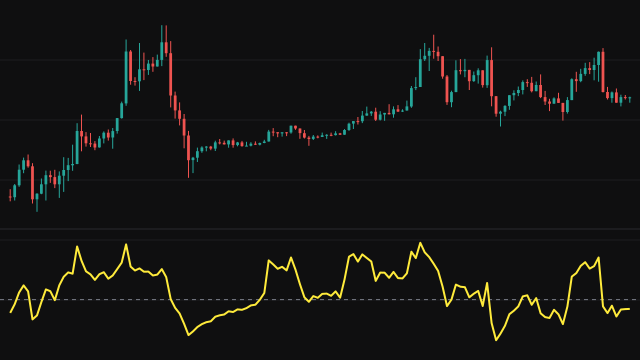
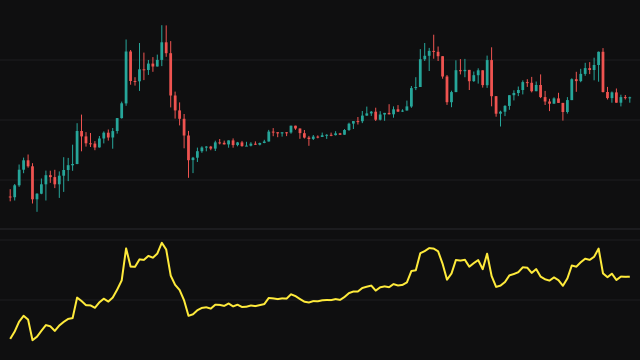
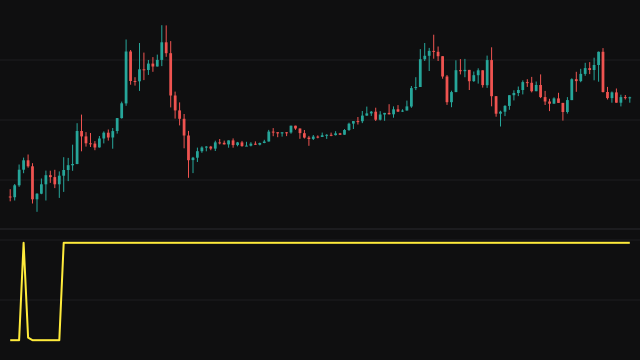
This Square Root Transformation (SQRT) computes y = sqrt(x) for each value of the chosen source, one bar at a time, with no lookback and no smoothing.
The effect is a change of scale. Quadrupling the source only doubles the result, so large readings are pulled in much more than small ones and a series that spans a wide range is laid out on a flatter curve. Bars where the source is negative, or missing, have no real root and are drawn as gaps rather than as zero.
How to read Square Root Transformation (SQRT)
Look at the pattern of the line, not its number. Rises and falls happen on the same bars as on the raw source, but swings at high levels look smaller and swings at low levels look larger, which helps when comparing behaviour across very different price levels.
The output is not a price, so it is not a level to trade against. Treat it as a view of the series that tames large values, or as a preparation step for statistics that expect a less skewed input.
Settings
- Source
- The series whose square root is drawn, such as the close or the bar midpoint.
Frequently asked questions
What happens when the source is below zero?
Nothing is drawn on that bar. A negative number has no real square root, and the study leaves a gap rather than inventing a value.
Why would I transform price at all?
A series that has grown many times over is dominated on a plain chart by its latest, largest moves. The square root evens that out so earlier moves stay visible.
Do turning points move?
No. The square root keeps the order of values, so highs and lows fall on the same bars as in the source.