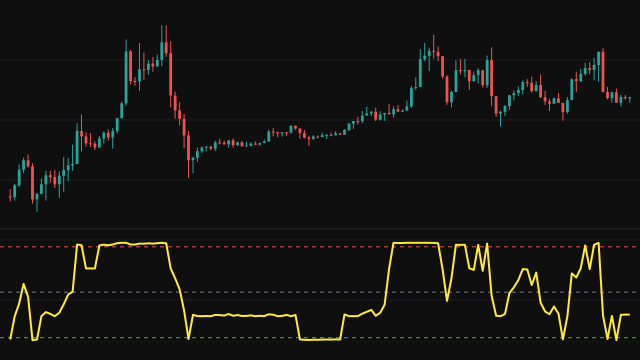
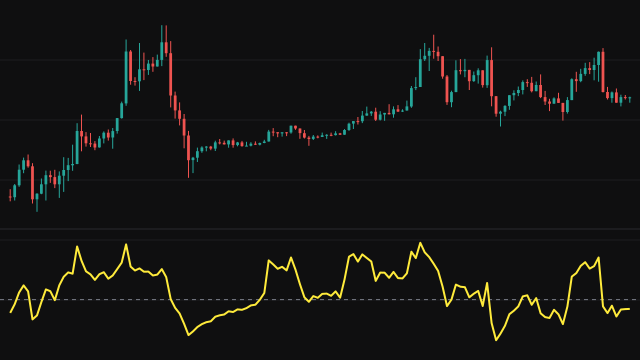
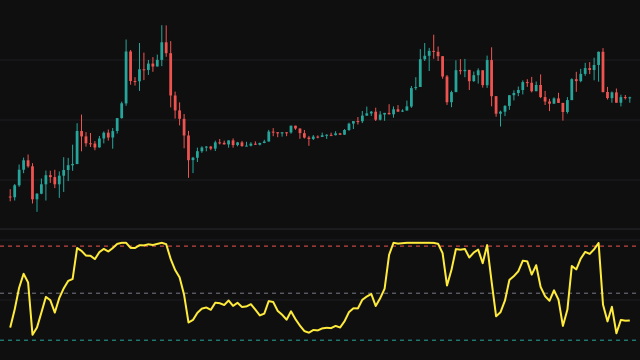
The Hyperbolic Tangent study takes the distance between the source and its 200-bar simple moving average, multiplies it by a steepness factor k, and passes the result through the hyperbolic tangent. The output is tanh(k * (source - SMA200)), which is 0 when price sits on its average, approaches +1 when price is far above it and approaches -1 when price is far below it.
The tangent is computed in a form that cannot overflow: with e = exp(-2|y|), the magnitude is (1 - e) / (1 + e), signed like y. Far from the average this is exactly plus or minus one. The 200-bar average needs 200 bars of history, so the line starts on bar 200.
How to read Hyperbolic Tangent (TANH)
Read the zero line as price at its long average. Positive values mean price is above it and negative values mean below, with the size of the value showing how stretched it is. Near the middle the curve is almost straight, so small distances are shown in proportion, while large distances are compressed against the limits of -1 and +1.
The distance is in price units, so the useful steepness depends on the instrument's price level. If the line spends most of its time at -1 or +1, lower k. The midpoint is a slow 200-bar average, so the study shows where price stands against its long trend rather than short-term swings.
Settings
- Source
- The series compared with its own 200-bar simple moving average.
- Steepness (k)
- Multiplies the distance from the average before the tangent is applied. A higher value makes the curve steeper around the zero line, so it saturates sooner.
Frequently asked questions
How is this different from the logistic sigmoid?
Both are S-shaped. The hyperbolic tangent runs from -1 to +1 with 0 at the average, while the logistic curve runs from 0 to 1 with 0.5 at the average. For the same input, tanh(y) equals 2 * sigmoid(2y) - 1.
Why does the line start late?
The inflection point is a 200-bar simple moving average, which has no value until 200 bars of history exist.
Why is the line flat at +1 or -1?
The distance from the average is large compared with 1 / k, so the curve is saturated. Lower the steepness to bring the line back into its working range.