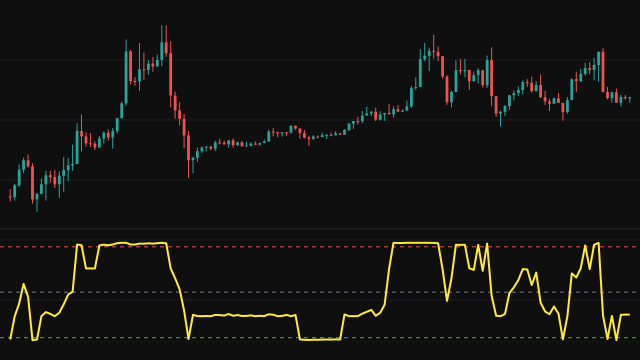
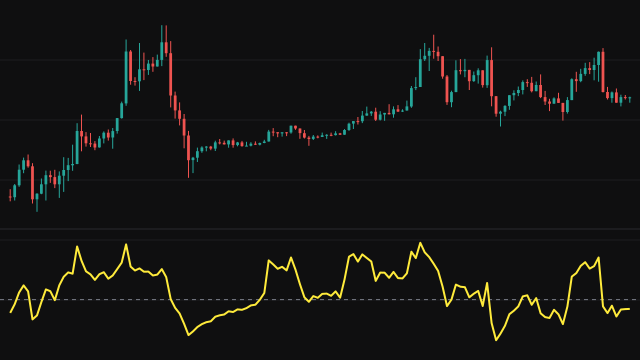
This study scans the last Period bars of the source for their highest and lowest values and works out where the current value sits between them, from 0 at the low to 1 at the high. A flat window counts as 0.5. Bars before the first bar of data count as zero, and a period of 1 still compares the current bar with the previous one.
That position is fed through the Weibull cumulative distribution, 1 minus exp(-(x / lambda) raised to k). The shape k sets the form of the curve: below 1 it is concave, at 1 it is the exponential case, at 2 the Rayleigh case, and above 3 it becomes an S-curve. The scale lambda sets how quickly it rises towards 1.
How to read Weibull Distribution CDF (WEIBULLDIST)
A reading near 1 means price is near the top of its recent range, and a reading near 0 means it is near the bottom. With the default shape of 2 and scale of 0.5 the curve rises quickly: the middle of the range reads about 0.63, three quarters of the way up reads about 0.89, and only the top eighth or so of the range passes 0.95. The 0.95 and 0.05 lines mark the extreme zones.
The study measures position, not direction. During a steady trend it can sit near one extreme for a long time, so it is best read alongside a trend measure, and the shape and scale should be set to the part of the range you want to resolve finely.
Settings
- Source
- The price series that is placed within its range, the close by default.
- Period
- How many bars the highest and lowest values are taken over. Longer periods give a wider and steadier range.
- Shape (k)
- The form of the curve: below 1 concave, 1 exponential, 2 Rayleigh, above 3 an S-curve.
- Scale (lambda)
- How quickly the curve rises. A larger scale keeps readings lower for longer; a smaller one pushes them to 1 sooner.
Frequently asked questions
Why does the line spend so much time near 1?
With the default scale of 0.5, the middle of the range already reads about 0.63 and the top of the range about 0.98. Raise the scale to spread the upper part of the range out.
What happens on the first bars?
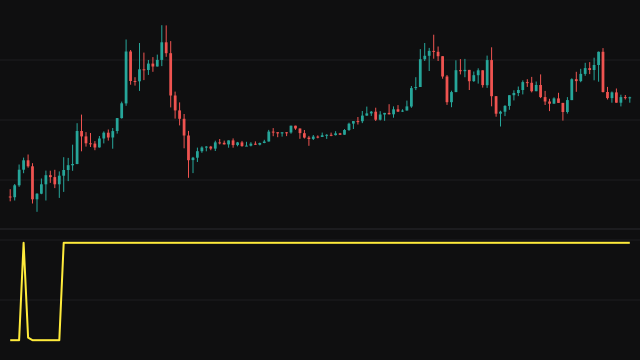
Bars before the start of the data count as zero, so early on the range reaches down to zero and the current price reads near the top of it.
Can it go below 0 or above 1?
No. It is a cumulative probability, so it always lies between 0 and 1.