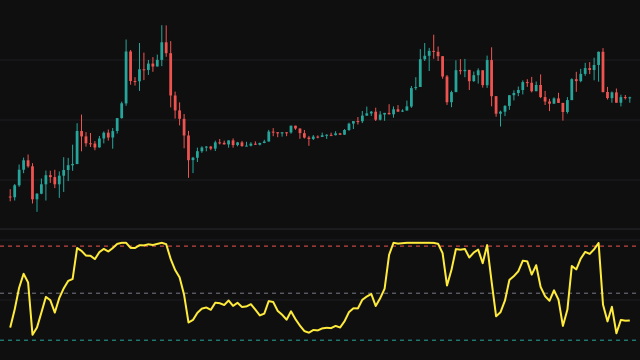
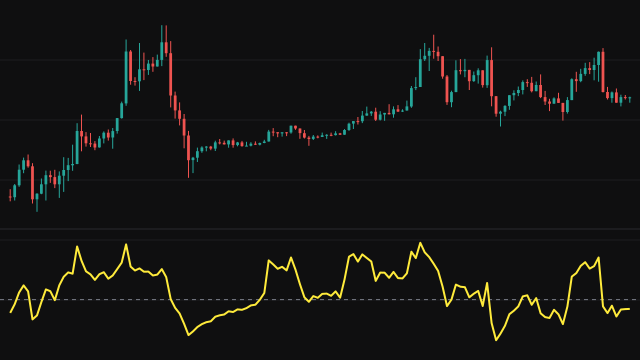
This study first finds where the source sits inside the highest and lowest values of the lookback window, as a fraction from 0 at the low to 1 at the high. A flat window counts as 0.5. That fraction is centred and stretched into a t-statistic running from -3 to 3, which is read through the cumulative distribution of Student's t with the chosen degrees of freedom. The output is a probability between 0 and 1.
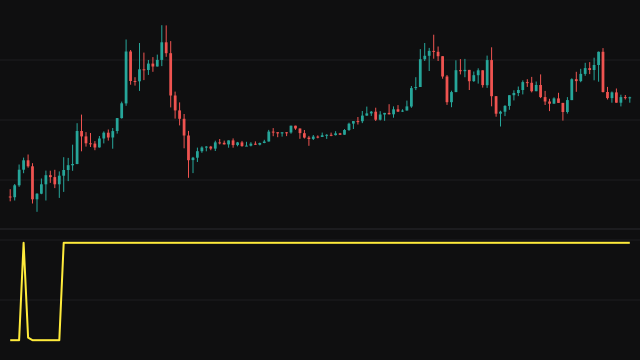
The distribution is evaluated through the regularized incomplete beta function, computed with a continued fraction. That continued fraction starts at its first even term, so the result runs a few percent from the textbook value and is pushed slightly towards the extremes. Until a full window exists, the bars before the first one count as zero, which widens the early range to include zero.
How to read Student's t-Distribution CDF (TDIST)
Readings near 0.5 put price in the middle of its recent range. Readings above the 0.95 line mean price is pressing the top of the range, and readings below 0.05 mean it is pressing the bottom. The degrees of freedom control how sharply the curve reacts: low values give heavy tails and a gentler response near the edges, high values approach the normal curve and saturate sooner.
The output describes position within a window, not momentum. In a strong trend it can stay near 1 or 0 for long stretches, so treat the extreme lines as context rather than reversal signals.
Settings
- Source
- The price series that is placed within its range, the close by default.
- Period
- How many bars the highest and lowest values are taken over. A longer period gives a wider, slower range.
- Degrees of Freedom
- Tail weight of the distribution. Lower values give heavier tails and a softer curve; higher values approach the normal distribution.
Frequently asked questions
Why does the early part of the chart look different?
Until a full window of bars exists, the bars before the first one count as zero, so the range is stretched down to zero and price reads near the top of it.
What do the degrees of freedom change?
They set how heavy the tails are. At 1 the curve is very flat in the tails, while large values make it behave like the normal curve and push readings towards 0 or 1 faster.
Is the probability exact?
Not quite. The continued fraction used here skips its leading term, so the result is a few percent away from the textbook value and slightly more extreme.