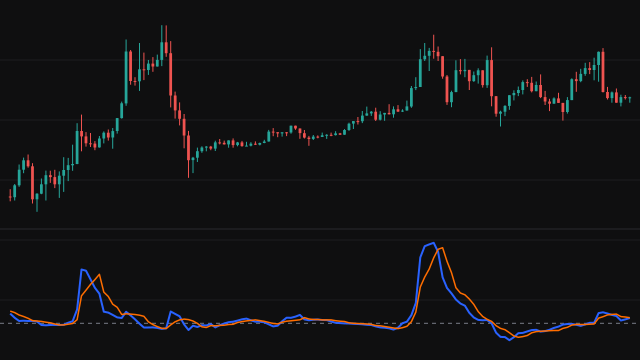
The Trend Thrust Indicator, designed by Buff Dormeier, measures trend momentum the way a moving average convergence divergence does, but from volume-weighted averages, and then lets the change in volume stretch or squeeze the spread. A volume-weighted average weighs each bar's price by the volume traded on it, so heavy bars pull the average harder than quiet ones.
The study takes a fast (12 bar) and a slow (26 bar) volume-weighted average of the source. The volume multiple is the average volume over the fast length divided by the average volume over the slow length, so it is above 1 while volume is expanding and below 1 while it is drying up. The fast average is multiplied by the squared multiple and the slow average by the squared reciprocal of the multiple. The indicator is the enhanced fast average minus the enhanced slow average.
The signal line is a 9 bar simple average of the indicator. Its author describes a signal that adapts its length to volume; this study uses the fixed-length simple average instead. Both lines are drawn in their own pane around a zero line.
How to read Trend Thrust Indicator (TTI)
A crossing of the indicator above its signal line is read as accumulation and a buy cue; a crossing below it as distribution and a sell cue. Because the multiple scales the two averages in opposite directions, the indicator rises well above zero whenever volume expands and falls well below zero when volume dries up, so its size reflects volume as much as the gap between the averages.
That sensitivity cuts both ways: a burst of volume can move the line sharply even when price has barely moved, and readings depend on the price level of the instrument. Compare readings over time on one instrument, use the crossings rather than the absolute values, and expect frequent crossings in a sideways market.
Settings
- Source
- The price series the volume-weighted averages are taken over. Close is the default.
- Fast Length
- Bars in the fast volume-weighted average and in the short volume average of the multiple. 12 is the published default.
- Slow Length
- Bars in the slow volume-weighted average and in the long volume average of the multiple. 26 is the published default.
- Signal Length
- Bars in the simple average that forms the signal line. A larger value gives a smoother, slower signal.
Frequently asked questions
How is it different from a plain moving average convergence divergence?
It uses volume-weighted averages instead of exponential ones, and it scales the fast average up and the slow average down by the squared volume multiple when volume is expanding (the reverse when it is contracting), so moves made on rising volume read larger.
What is the volume multiple?
The average volume over the fast length divided by the average volume over the slow length. It is 1 when recent volume matches the longer average, above 1 when volume is expanding and below 1 when it is fading.
Why can the line jump when price is flat?
The multiple scales the averages themselves, not only their gap. A sudden change in volume moves the enhanced averages apart even if price is steady, which is how the indicator gives weight to volume.