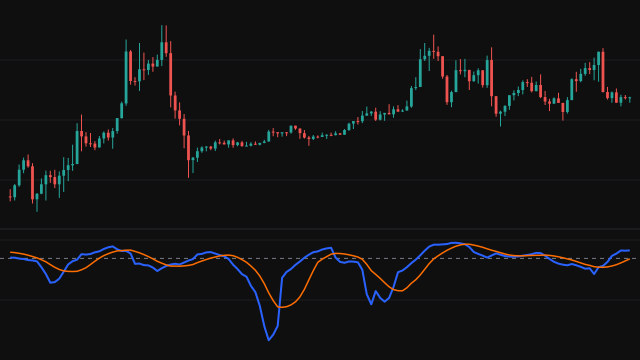
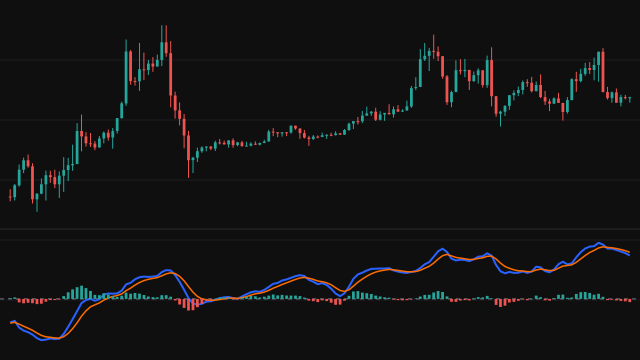
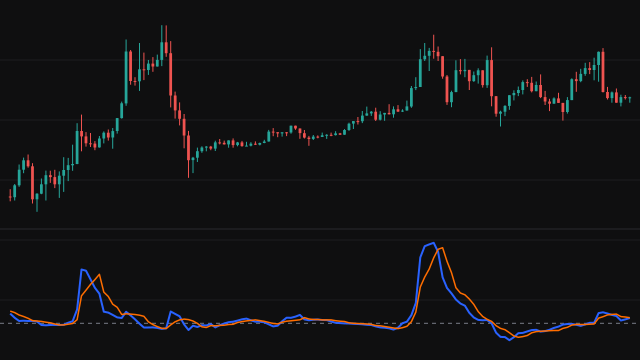
The Volume Zone Oscillator, described by Walid Khalil and David Steckler, measures whether volume is going with rising or falling closes. Each bar's volume is given a sign: positive when the close is above the previous close, negative when it is below, and zero when it is unchanged.
The oscillator divides an exponential average of that signed volume by an exponential average of the plain volume over the same Length (14 bars by default) and multiplies by 100. Both averages start on the second bar (the first has no previous close) and are seeded with a simple average of their first Length values, so they always cover the same bars with the same weights. A reading of 100 would mean every bar in the average closed up, and -100 that every bar closed down.
Dashed levels mark the zones: 60 and -60 for overbought and oversold, 40 and -40 for the edges of a bullish or bearish trend, and 15 and -5 around a neutral middle. These are the levels the authors published; the neutral band is not centred on zero.
How to read Volume Zone Oscillator (VZO)
Above 40 volume is going mostly with rising closes, which is read as a bullish trend; below -40 as a bearish trend. Readings beyond 60 or -60 are stretched, and a turn back from there often comes before a pause or a pullback. Between 15 and -5 buying and selling volume are roughly balanced, and the authors treat a market with no clear trend as a swing between these lines and the 40 and -40 zones.
In a trend, traders look for the oscillator to hold its side of zero and use dips toward the 40 or -40 zone as pullbacks. The oscillator only knows the direction of the close, not how far it moved, so a large down bar and a tiny one count the same. It needs volume and shows nothing without it.
Settings
- Length
- Bars in both exponential averages. Shorter reacts faster and crosses the zones more often; 14 is the usual value.
Frequently asked questions
Why can it not go beyond 100 or -100?
Both averages cover the same bars with the same weights, and each bar's signed volume is at most its full volume, so the top can never exceed the bottom. 100 means every bar in the average closed up.
How is it different from on-balance volume?
Both sign volume by the direction of the close. On-balance volume adds it up forever, while this oscillator averages it and divides by average volume, so it stays in a fixed range and can be read against fixed zones.
What happens on a bar that closes unchanged?
Its signed volume is zero, but its volume still enters the lower average, so the oscillator moves toward zero.