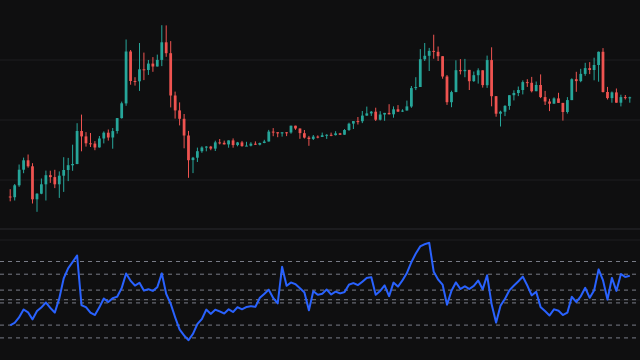
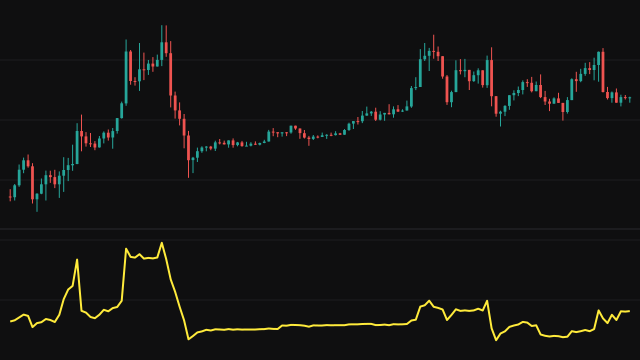
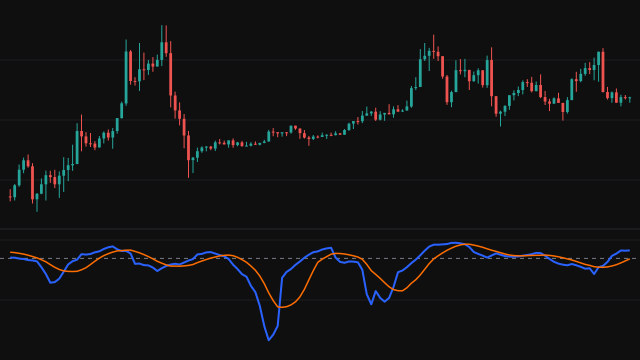
The Volume Flow Indicator, described by Markos Katsanos, refines on-balance volume in three ways. It uses the typical price (the average of high, low and close) instead of the close, it ignores bars whose move is too small to matter, and it caps volume spikes so a single heavy bar cannot dominate.
The noise cutoff is Cutoff Coefficient (0.2) times the standard deviation of the log change of the typical price over Volatility Length (30) bars, multiplied by the close to put it in price terms. Volume is capped at Volume Cap (2.5) times its simple average over the previous Length (130) bars. A bar whose typical price rose by more than the cutoff adds its capped volume, one that fell by more subtracts it, and any other bar adds nothing.
The flow is summed over Length bars and divided by the same average volume, then smoothed with an exponential average over Smoothing (3) bars to give the VFI line. The Signal line is an exponential average of VFI over Signal Length (5) bars, and the Histogram is VFI minus the signal.
How to read Volume Flow Indicator (VFI)
VFI above zero means more capped volume went with meaningful rises than with meaningful falls over the window, which is read as accumulation; below zero as distribution. A rising VFI while price falls, or a falling one while price rises, is a divergence that often comes before a turn. Crossings of zero are the main signals; crossings of the signal line and the histogram show shorter swings within them.
The long window makes it slow by design, and it needs a long history before the first value: about 260 bars with the defaults. It reads volume, so it shows nothing without it, and it treats every bar inside the cutoff as neutral however much volume traded.
Settings
- Length
- Bars summed for the flow and averaged for the volume cap and the scale. 130 is the usual value; shorter makes the indicator faster and noisier.
- Cutoff Coefficient
- Multiple of the volatility that a move must exceed to count. Higher ignores more bars as noise; 0 counts every up or down bar.
- Volume Cap
- Largest volume a bar can contribute, as a multiple of average volume. Lower damps spikes more.
- Volatility Length
- Bars in the standard deviation of the log change that sets the cutoff.
- Smoothing
- Bars in the exponential average applied to the raw flow to give the VFI line. 1 leaves it unsmoothed.
- Signal Length
- Bars in the exponential average of VFI drawn as the signal line.
Frequently asked questions
How is it different from on-balance volume?
On-balance volume adds the whole volume of every up bar and subtracts every down bar forever. This indicator ignores moves smaller than a volatility cutoff, caps spikes, uses the typical price and sums over a fixed window, so it stays near a range and can be read against zero.
Why is the volume average taken up to the previous bar?
So that a bar with a volume spike does not raise its own cap. The cap and the scale come from the bars before it.
Why does it take so long to appear?
It needs the 130 bar average, then 130 bars of flow, then the smoothing. With the defaults the first value appears around bar 260.