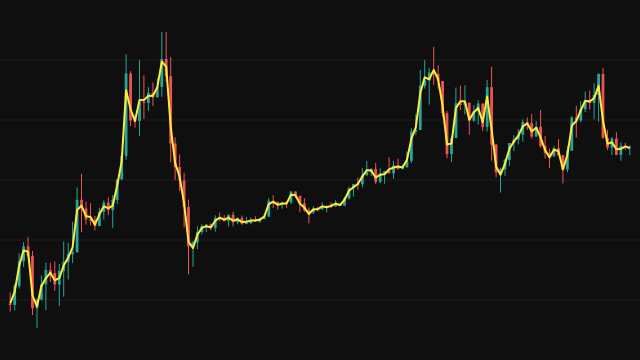
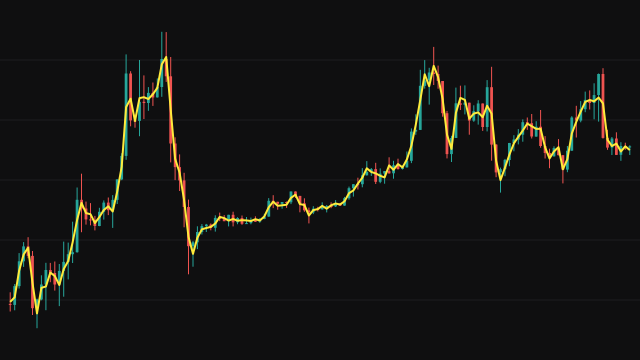
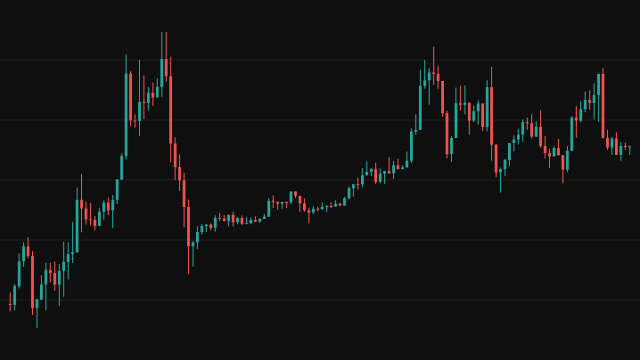
Typical Price reduces each bar to a single number that stands in for the whole bar. It adds the high, the low and the close and scales the total to a third, so the line sits roughly in the middle of where the bar traded, pulled slightly towards the close.
The study scales by the constant 0.333333 rather than dividing by exactly 3, so its values sit a fraction of a unit below an exact third on high-priced instruments. On a price near 60,000 the line sits about 0.06 below an exact third. There are no settings and no warmup: the line starts on the first bar.
How to read Typical Price (HLC3)
Read the line as a smoother version of the close. Because it includes the high and the low, a bar with a long wick pulls the line towards that wick even if the close finished elsewhere. Many other studies, such as money flow and commodity channel calculations, use this price as their input, so plotting it shows exactly what they are reading.
It is not a signal on its own. Crossings of price and this line happen constantly and carry little meaning; use it as a reference price or as the input to another calculation.
Frequently asked questions
Why is the value slightly below (high + low + close) / 3?
The study multiplies by 0.333333 instead of dividing by 3. The gap is one part in a million of the price, which is invisible on a chart but shows up in the last decimals.
How is it different from the close?
The close is one moment of the bar. The typical price blends the close with the bar's extremes, so it moves less on bars that closed near one end of a wide range.
Does it need any history?
No. Each bar's value uses only that bar, so the line is drawn from the very first bar and never changes once the bar has closed.