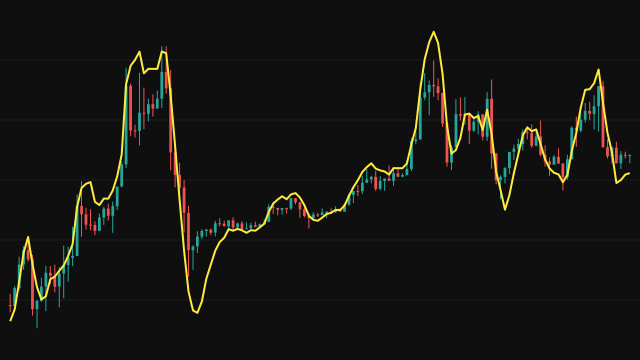
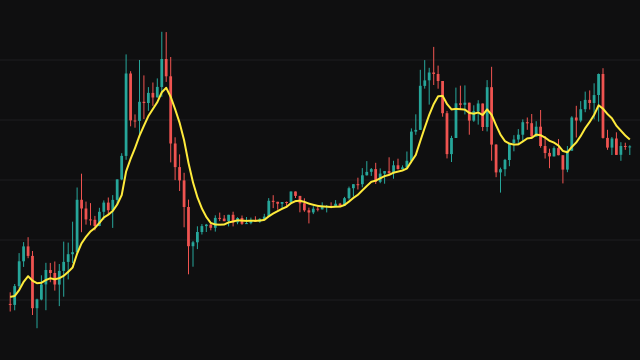
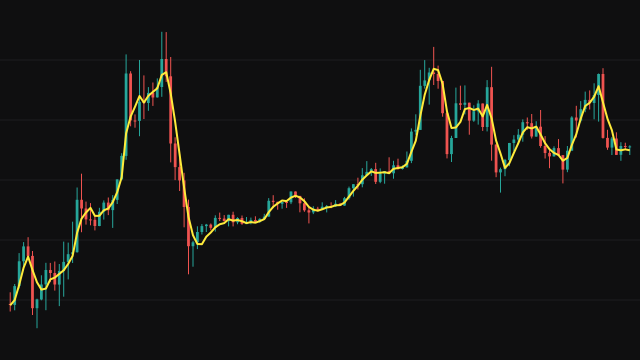
This study is a simple moving average whose length changes with volatility. Volatility is measured bar by bar from all four prices: the squared log jump from the previous close to this open, plus the squared log move from open to close weighted by k, plus a high-low term around the open weighted by 1 - k, where k = 0.34 / (1.34 + (n + 1) / (n - 1)) and n is the short period. That variance is smoothed with a running average of weight 1 / n, corrected for its zero start, and its square root is the short-term volatility.
The current volatility is ranked among the last percentileLookback readings, itself included, as the share it exceeds, from 0 to 100. A rank of 0 gives the maximum length and a rank of 100 the minimum, moving linearly in between and rounded down. The line is the plain mean of the newest that many source values, taken from the last maxLength bars.
How to read Yang-Zhang Volatility Adjusted Moving Average (YZVAMA)
When volatility is high compared with its recent history, the average shortens and tracks price closely, so it turns quickly in a fast market. When volatility is low, it lengthens and smooths out the noise of a quiet market. Read it like any moving average on price: price above a rising line describes an uptrend, below a falling line a downtrend.
Because the length can jump from one bar to the next, the line can step sharply when the volatility rank changes. It adapts to how volatile the market is, not to its direction, so a sharp sell-off shortens it just as a sharp rally does. The Long YZV Period setting is part of the indicator's settings but does not change the line.
Settings
- Source
- The price series the average follows, the close by default.
- Short YZV Period
- The smoothing period of the short-term volatility that is ranked. A shorter period makes the length react to volatility changes faster.
- Long YZV Period
- Kept with the indicator's settings, but no part of the line reads it, so changing it does not change the average.
- Percentile Lookback
- How many past volatility readings the current one is ranked against. A longer lookback makes extreme ranks rarer.
- Minimum Length
- The shortest the average can become, used when volatility ranks at the top of its lookback. A value above the maximum is held at the maximum.
- Maximum Length
- The longest the average can become, used when volatility ranks at the bottom of its lookback. It is also how many bars of source are kept.
Frequently asked questions
Why does the line sometimes jump?
The length is recalculated on every bar from the volatility rank. When the rank moves a lot, the number of bars averaged changes at once, and the mean steps to a new level.
What does the Long YZV Period do?
Nothing to the line. It is part of the settings, but no part of the calculation that produces the average reads it.
Does high volatility make the line shorter or longer?
Shorter. A high volatility rank moves the length toward the minimum, so the average follows price more closely when the market is active.