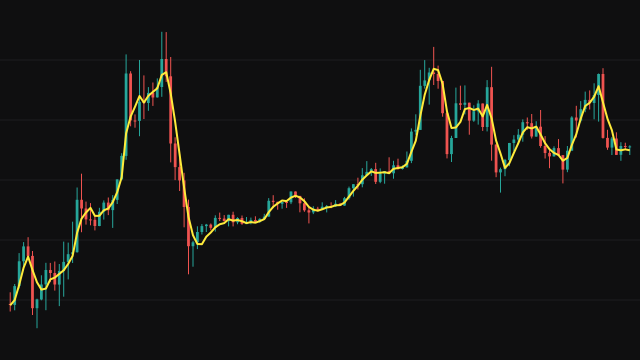
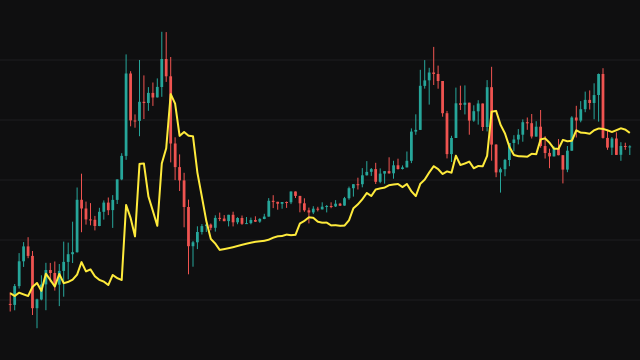
Zero-Lag Double EMA stacks two ways of reducing lag. First the price is corrected: the de-lagged price is 2 * price - price lag bars ago, where the lag is half the period minus a half, rounded down, and at least one bar. Until that older price exists, the current price stands in for it.
The de-lagged price then passes through two exponential averages in a chain, each with weight 2 / (period + 1). Both start from zero, and while the zero start still carries weight e, each stage is multiplied by 1 / (1 - e) so the line starts on price instead of rising from zero. The result is the double average with its own lag subtracted once, 2 * first - second.
How to read Zero-Lag Double EMA (ZLDEMA)
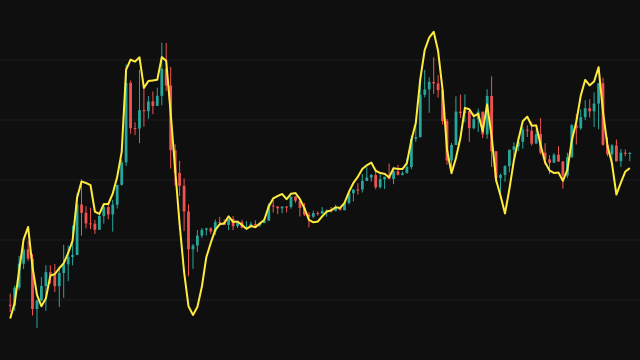
Read it as a fast moving average on price. Price above a rising line describes an uptrend, below a falling line a downtrend, and the slope turning is an early sign that the move is fading. It reacts faster than a plain exponential average of the same period and faster than a single zero-lag average, so it suits traders who want early turns and accept more false ones.
The double correction makes the line overshoot after sharp moves, and in a sideways market it wanders through price often. Pair it with a slower line or a trend filter rather than treating each cross as a signal on its own.
Settings
- Period
- Sets the weight of the two averages as 2 / (period + 1) and the lag of the correction as (period - 1) / 2, rounded down and at least 1. A longer period gives a smoother, slower line.
- Source
- The price series the average follows, the close by default.
Frequently asked questions
How is it different from Zero-Lag EMA?
Zero-Lag EMA applies one exponential average to the de-lagged price. This study applies two in a chain and subtracts the second from twice the first, which removes more lag and makes the line faster and more prone to overshoot.
Why does it overshoot price?
Both the price correction and the double average project the recent move forward. After a sharp reversal they keep pointing the old way for a few bars.
Is the first part of the line reliable?
It is drawn from the first bar because each stage is corrected for its zero start, but the early values rest on very few bars and are best treated as approximate.