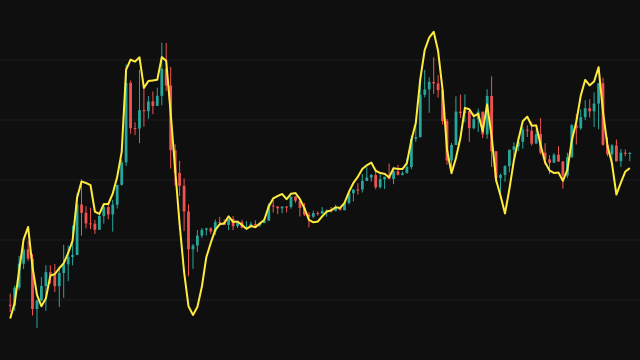
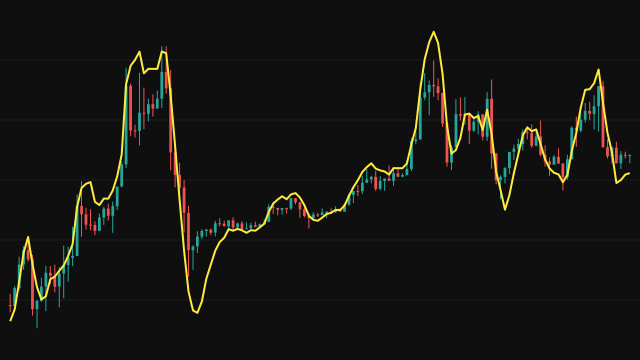
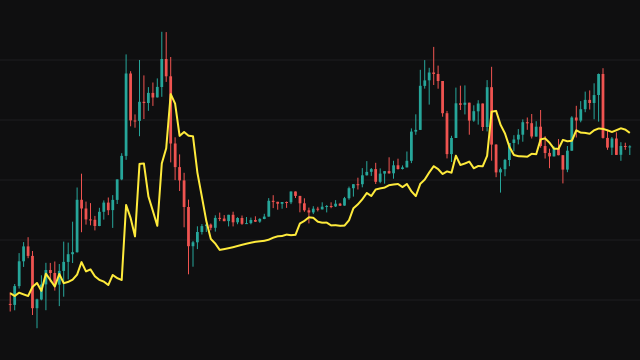
Zero-Lag EMA reduces the delay of an exponential average by feeding it a corrected price instead of the raw one. The correction lag is half the period minus a half, rounded down, and never less than one bar: 4 bars at the default period of 10. The de-lagged price is 2 * price - price lag bars ago, which is today's price plus the distance it travelled over that lag. While fewer than lag bars exist the older price is read as 0, so the first few de-lagged values are near twice the price.
That de-lagged price is averaged with weight 2 / (period + 1). The average starts from zero, and during warmup it is divided by 1 - e, where e is the weight the zero start still holds, so the line is not dragged toward zero over the first bars. Once that weight is negligible the plain average is used.
How to read Zero-Lag EMA (ZLEMA)
Read ZLEMA like any moving average drawn on price: price above a rising line describes an uptrend, price below a falling line a downtrend, and a cross of price through the line is an early sign of a turn. Compared with an ordinary exponential average of the same period it turns sooner, which gives earlier signals at the cost of more whipsaws in a sideways market.
The line can overshoot price after a sharp move, because the correction extends the most recent change. Disregard the first lag bars of the chart, where the older price is read as zero and the line starts well above price before settling.
Settings
- Period
- Sets the weight of the average as 2 / (period + 1) and the lag of the correction as (period - 1) / 2, rounded down and at least 1. A longer period gives a smoother, slower line.
- Source
- The price series the average follows, the close by default.
Frequently asked questions
Why does the line start far above price?
Until lag bars exist the older price in the correction is read as zero, so the de-lagged price is about twice the actual price. The line settles onto price within those first few bars.
How much lag does it remove?
The correction adds the change over half the period to the price, which offsets most of the delay an exponential average of that period carries. It is not truly zero lag; it is much less lag.
Why does it overshoot at turns?
The correction projects the recent change forward. When price reverses sharply, the projected change is still pointing the old way for a few bars, so the line runs past price before turning.