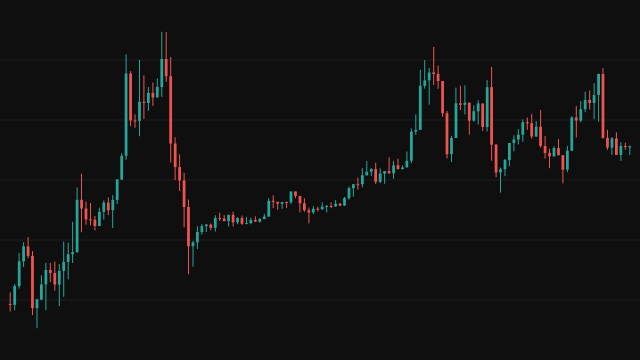
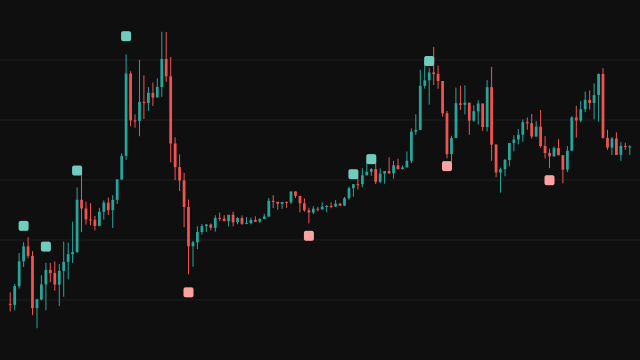
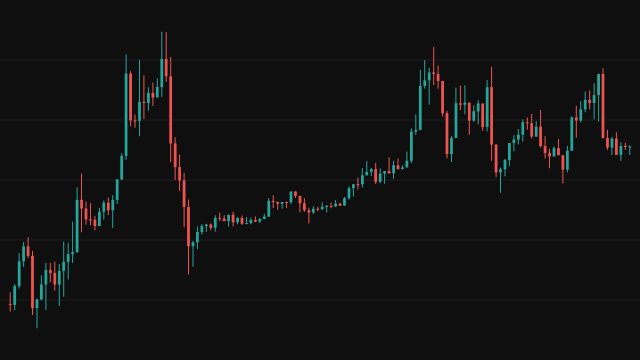
Note. The performance table sits in the nearest of the four chart corners and at the chart's own text size, because a table here has no centre or middle positions and no size setting.
A displacement is a fast, one-sided move made of long candles. This study tests every bar for it. A bar is a bullish displacement candle when it closes above its open, its high-low range is at least the Minimal Deviation percentage of the average high-low range of the last 14 bars, and (with the default filter) it closes above the previous close. A bearish candle is the mirror image. Until the 14-bar average exists the size threshold is zero, so the first bars only need the right direction. Optional filters also demand a close beyond the previous high or low, or a range larger than the ATR times a multiplier.
Consecutive candles of one side form a run, and any other bar ends it. When a run of at least Minimum Bars candles ends, its length is printed as a label on its last candle. While a run is long enough, the study keeps a level inside it: the run's highest high minus its height times the Fibonacci Value for a bullish run, and the lowest low plus the height times that value for a bearish one. At 0.5 that is the midpoint of the run.
With the Retracement method the study waits for price to come back to that level. The first bar whose low crosses down through a bullish run's level (or whose high crosses up through a bearish run's level), coming from the far side, is marked with a triangle, its candle is coloured, and a dotted line is drawn from the run's first candle to that bar. Each run produces at most one retracement signal, and a new run on either side replaces the one being watched. A small table on the newest bar shows the sum of the bar-to-bar percentage changes since the day began, the day's volume so far against the whole previous day's volume as a percentage change, and both volumes in lakhs (units of one hundred thousand). Days are calendar days in the chart's timezone.
How to read Displacement Candles Indicator
A number label marks the end of a displacement run and says how many candles it held: light green above the candle for a bullish run, light red below it for a bearish run. A longer run is a longer stretch of consecutive large candles in one direction. On the Retracement setting, a light green triangle under a candle, with the candle painted the same colour, is the first pullback into a bullish run's Fibonacci level, a possible place to rejoin the move, and a light red triangle above a light red candle is the same for a bearish run. The dotted line shows which run and which level the signal belongs to.
A triangle is drawn once its bar has closed, and it is not a prediction: a pullback can continue straight through the level. The time and date filters read the bar's clock in the chart's timezone, so set them for the chart you use.
Settings
- Scanning Method
- Displacement shows only the run labels. Retracement also marks the first pullback to each run's Fibonacci level, with a triangle, a coloured candle and a dotted line.
- Long Signals
- Show the bullish run labels and the bullish retracement signals.
- Short Signals
- Show the bearish run labels and the bearish retracement signals.
- Minimum Bars
- How many displacement candles in a row a run needs before it is labelled and its Fibonacci level is watched.
- Minimal Deviation (%)
- The smallest range a candle can have to count, as a percentage of the 14-bar average high-low range. Raise it to keep only larger candles.
- Apply Close Above/Below Prev Close
- Require a bullish candle to close above the previous close, and a bearish one below it.
- Apply Close Above/Below Prev High/Low
- Require a bullish candle to close above the previous high, and a bearish one below the previous low.
- Fibonacci Value
- Where the retracement level sits inside the run: 0 at the far end of the move, 1 at its start, 0.5 at the midpoint.
- Apply ATR Filter
- Require each candle's range to exceed the ATR times the multiplier. An ATR still warming up blocks the candle.
- ATR Length
- The number of bars in the average true range used by the ATR filter.
- ATR Multiplier
- How many ATRs a candle's range must exceed when the ATR filter is on. Higher values keep only the largest candles.
- Apply Time Filter
- Allow retracement signals only between the start and end time below, read on the chart's clock.
- Time From (hour)
- The hour at which the time window opens.
- Time From (minute)
- The minute at which the time window opens.
- Time To (hour)
- The hour at which the time window closes; a bar at that exact time is outside it.
- Time To (minute)
- The minute at which the time window closes.
- Apply Date Filter
- Allow retracement signals only on the one calendar date set below.
- Day
- Day of the month for the date filter.
- Month
- Month, 1 to 12, for the date filter.
- Year
- Year for the date filter.
- Display
- Show the table of the day's percentage change and volume figures.
- Position
- Where the table sits. Each position is drawn in its nearest corner of the chart.
- Size
- Text size of the table. Tables in this version draw at the chart's own text size, so every choice looks the same.
Frequently asked questions
Why are the first few candles of the chart counted so easily?
The size test compares each candle with the average range of the last 14 bars. Until 14 bars exist there is no average, so the threshold is zero and any candle in the right direction counts.
Why do I see run labels but no triangles?
Triangles, coloured candles and dotted lines appear only with the Scanning Method set to Retracement. On Displacement the study only labels the runs.
Can one run give more than one retracement signal?
No. A run is marked done on its first retracement signal and is watched again only if a new run reaches the minimum length. A new run on the other side also replaces it.
Why does the table show 0 L for volume?
Volume is shown in lakhs, one hundred thousand units, rounded to two decimals. On an instrument with small traded quantities, such as a crypto pair quoted in coins, the day's volume rounds to zero.