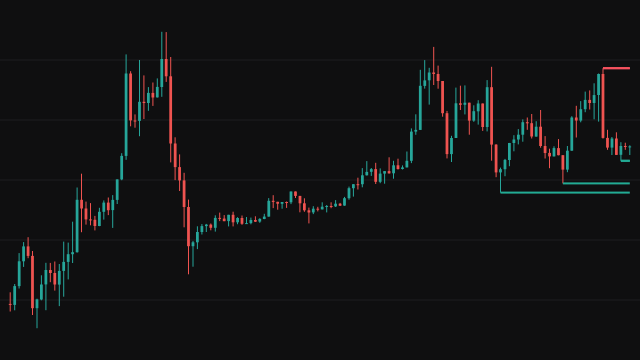
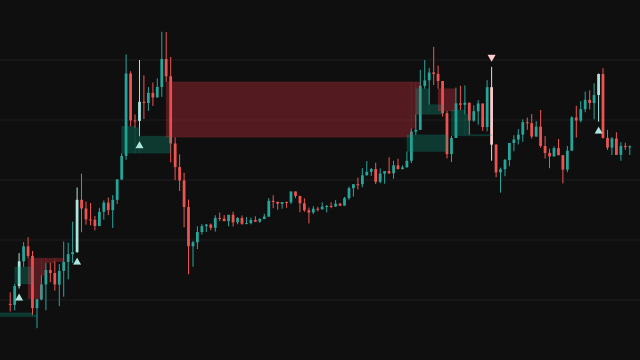
Equal highs and equal lows are two swing points of the same side that print at almost the same price. Resting orders tend to collect just beyond such a level, stops above a pair of equal highs and below a pair of equal lows, so the pair marks a place price may be drawn to and run through.
A swing high is a bar whose high (or candle body top, with the Open/Close source) is the highest of Left bars before it and Right bars after it; a swing low is the mirror image. Each swing is only known Right bars after it forms. The study keeps the two newest swings of each side and measures the gap between them as a percentage of the older one. When a new swing arrives and that gap is below Equal HL %, the pair is boxed from the earlier swing to the later one and the later swing bar is tagged EQH or EQL at its own high or low. Only the newest 50 boxes are kept.
The screener table lists the most recent hits on this chart, newest first, with the bar's time in Indian time (IST), H for an equal high or L for an equal low, and the close rounded to the instrument's tick. With the Equals method a hit is the bar that confirms the pair; with Equals Sweep a hit waits until the high crosses above the newest equal high, or the low crosses below the newest equal low, while the pair is still within the percentage.
How to read Equal Highs and Lows with Screener
Read each box as a level where price has turned twice at nearly the same place. Many traders expect price to be drawn towards such a level and to run through it before a real move, so a box above the market marks a possible target for a rally and a box below marks one for a decline. A sweep hit in the table says that run through the level has just happened.
The swings are confirmed Right bars late, so a box and its tag appear well after the second swing formed. With the default 60 and 30 bars only large swings count, and on a fast chart pairs are rare; lower the lengths or raise the percentage to see more of them, at the cost of weaker levels.
Settings
- Screening Method
- Equals lists a pair on the bar that confirms it. Equals Sweep lists it only when price crosses through the newest equal level.
- Direction
- Both lists equal highs and equal lows. Bullish drops the equal lows from the table and Bearish drops the equal highs.
- Only Bullish
- When off, equal lows are left out of the table. The boxes and tags are drawn either way.
- Only Bearish
- When off, equal highs are left out of the table. The boxes and tags are drawn either way.
- Display Rows
- How many of the latest hits the table lists, newest first. Zero hides the table.
- Table Position
- Where the table sits. Each of the nine positions is drawn in its nearest corner of the chart.
- Table Size
- The text size asked for the table. Tables in this version draw at the chart's own text size, so changing it has no visible effect.
- Left
- Bars before a swing that it must stand above or below. Larger values keep only bigger swings.
- Right
- Bars after a swing that it must stand above or below. Larger values confirm swings later and keep only bigger ones.
- Equal HL %
- The largest gap, as a percentage of the older swing, for two swings to count as equal. Lower values demand closer prices.
- Source
- High/Low finds swings on the wicks. Open/Close finds them on the candle bodies, ignoring the wicks. A swing must stand strictly above or below its neighbours, so on a market where every bar opens at the previous close (one that trades round the clock) neighbouring bodies always share an edge and Open/Close finds no swings at all.
Frequently asked questions
Why does a box appear so long after the second swing?
A swing is only confirmed once Right bars have closed after it without beating it. With the default of 30 bars the box is drawn 30 bars after the later swing formed, and nothing drawn changes after that.
Why do the Only Bullish and Only Bearish switches seem reversed?
The Direction menu calls an equal high bullish and an equal low bearish, but the two switches are wired the other way round: Only Bullish lists the equal lows and Only Bearish lists the equal highs. They change only the table, never the boxes or tags.
Does the screener scan other symbols?
No. It runs the same test on the chart's own instrument and lists the hits found in the bars loaded on the chart.
Why are some old boxes missing?
Only the newest 50 boxes are kept, to keep a long chart readable. The EQH and EQL tags stay on every pair.