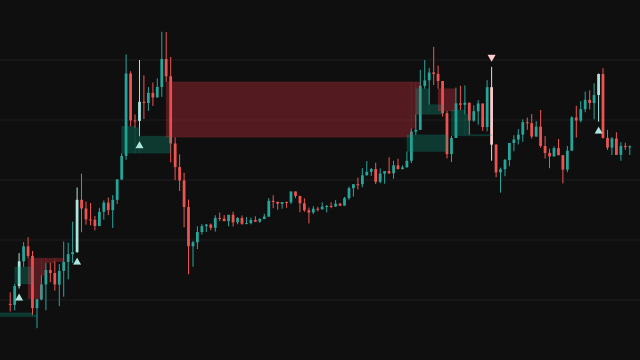
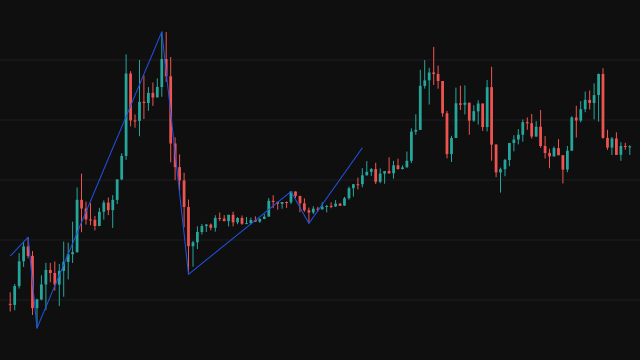
The study maps swing highs and swing lows, the prices beyond which resting stop orders are commonly assumed to sit, and shows which of them price has already traded through. For each of three timeframes, 15, 60 and 240 minutes by default, it folds the chart's bars into higher timeframe bars and finds pivot highs and pivot lows on them: a bar whose high is strictly above the Left bars before it and the Right bars after it, and the mirror image for lows. A pivot is read one completed higher timeframe bar later, unless the timeframe is no coarser than the chart, so a level never appears before the bars that confirm it.
Each level is drawn from the chart bar that actually made the swing, found by searching back for the bar whose high or low (or body top or bottom, with Open/Close) sits closest to the pivot price, and runs forward bar by bar until a bar's high is above it and its low below it. That bar traded through the level, and the line stops on the bar just before it. Only the newest levels are kept for each timeframe, highs and lows counted together, and an optional label shows the price.
A separate pass works on the chart's own bars with much wider pivots, 60 bars left and 30 right by default. When two consecutive swing highs, or two consecutive swing lows, differ by less than Equal HL % percent, the study boxes the pair and marks the newer swing with an x. The newest 50 boxes are kept. The Source setting switches every pivot between the wicks and the candle bodies.
How to read External Range Liquidity Static Multi-timeframe (Swing High and Low)
Red lines are swing highs and green lines are swing lows. A line that is still running to the right is untouched: no bar since the swing has traded through it. A line that stops has been taken: the next bar after its end is the first one whose high was above the level and whose low was below it. Each timeframe uses the same colours, so set a different line style per timeframe to tell them apart.
Equal highs and equal lows, the shaded boxes, are two consecutive swings of the same kind within Equal HL % of each other, the box spanning from the older swing's bar and price to the newer one's. Because pivots need bars on both sides to confirm them, every level and box appears some bars after the swing that made it; the study never draws one sooner. The levels show where earlier swings turned, not whether price will reach them.
Settings
- Pivot High Low 1
- Draw the levels of the first timeframe.
- Pivot High Low 2
- Draw the levels of the second timeframe.
- Pivot High Low 3
- Draw the levels of the third timeframe.
- Equal Pivot High Low
- Draw the equal high and equal low boxes and their x marks.
- Source
- High/Low reads the wicks; Open/Close reads the candle bodies, so a long shadow does not set a swing.
- PHL 1 Timeframe
- The first timeframe: a number for minutes, or D, W or M; blank uses the chart's own bars.
- PHL 1 Left
- Higher timeframe bars before a pivot that must sit below a high or above a low.
- PHL 1 Right
- Higher timeframe bars after a pivot that confirm it; a larger value draws the level later.
- PHL 1 Show Last
- How many of the newest levels to keep, highs and lows counted together; 0 hides them.
- PHL 1 Line Extend
- Run every level to the newest bar instead of stopping it where price traded through.
- PHL 1 Line Style
- Solid, dashed or dotted lines for the first timeframe.
- PHL 1 Line Width
- Thickness of the first timeframe's lines.
- PHL 1 Label
- Write each level's price at its right end, or at its left end if it never extended.
- PHL 2 Timeframe
- The second timeframe, 60 minutes by default.
- PHL 2 Left
- Higher timeframe bars before a pivot of the second timeframe.
- PHL 2 Right
- Higher timeframe bars after a pivot of the second timeframe that confirm it.
- PHL 2 Show Last
- How many of the second timeframe's newest levels to keep.
- PHL 2 Line Extend
- Run the second timeframe's levels to the newest bar.
- PHL 2 Line Style
- Solid, dashed or dotted lines for the second timeframe.
- PHL 2 Line Width
- Thickness of the second timeframe's lines.
- PHL 2 Label
- Write the price of each of the second timeframe's levels.
- PHL 3 Timeframe
- The third timeframe, 240 minutes by default.
- PHL 3 Left
- Higher timeframe bars before a pivot of the third timeframe.
- PHL 3 Right
- Higher timeframe bars after a pivot of the third timeframe that confirm it.
- PHL 3 Show Last
- How many of the third timeframe's newest levels to keep.
- PHL 3 Line Extend
- Run the third timeframe's levels to the newest bar.
- PHL 3 Line Style
- Solid, dashed or dotted lines for the third timeframe.
- PHL 3 Line Width
- Thickness of the third timeframe's lines.
- PHL 3 Label
- Write the price of each of the third timeframe's levels.
- Equal Left
- Chart bars before a swing that it must stand above or below, for the equal high and low pass.
- Equal Right
- Chart bars after a swing that confirm it; the box appears this many bars after the newer swing.
- Equal HL %
- The largest gap between two swings, as a percentage of the older one, that still counts as equal.
- Transparency
- Transparency of the equal boxes and marks, from 0 (solid) to 100 (invisible).
Frequently asked questions
Why does a line stop where it does?
A level runs forward until the first bar whose high is above it and whose low is below it. That bar traded through the level, so the line ends on the bar just before it. With Line Extend on, every level runs to the newest bar instead.
Why does a level start before the bar where it appeared?
The pivot is found on the folded higher timeframe bars, but the line is anchored to the chart bar whose high or low sits closest to the pivot price, which is the bar that actually made the swing. It only becomes known some bars later, once the pivot is confirmed.
Why are there so few equal high and low boxes?
The default needs two consecutive swings, each confirmed by 60 bars before and 30 after, within 0.05 percent of each other, which few pairs meet. Raise Equal HL % or shorten Equal Left and Equal Right to see more pairs.
What does Open/Close change?
Every pivot, on all three timeframes and in the equal pass, is read from the candle bodies instead of the wicks. A pivot must be strictly above (or below) its neighbours, so on a market where every bar opens exactly at the previous close no body can form one and nothing is drawn; that is the case on many continuously traded instruments. Open/Close is useful where bars open with gaps.