A fair value gap is a three-bar imbalance. A down gap forms when this bar's high stays below the low of the bar two back, leaving a stretch of price that the middle bar crossed without any overlap; an up gap is the mirror image, with this bar's low above the high two bars back. A gap only counts when it is at least Minimal Deviation (%) of the 14-bar average high-low range, and while that average is still warming up every gap counts.
Each gap is drawn as a box from the first of its three bars and trailed to the right until price fills it. With Close FVG Partially on, every bar that trades into the gap freezes the current box and starts a smaller one over the part price has not yet reached, and the gap ends when price trades through its far edge. With it off, the first touch ends the gap. Max Bars can also end a gap after a fixed number of bars, and only the newest Max Number of FVG gaps are kept on the chart, each with all of its boxes.
The scanner follows the newest gap on each side through six stages. FVG % is the gap itself. First Touch is a later bar whose high crosses above the near edge of a down gap (or whose low crosses below the near edge of an up gap). Full Fill is a high crossing above the far edge of a down gap with the close still below that edge (or a low crossing below the far edge of an up gap with the close still above it). Reversal is a close that crosses beyond the far edge. The two Confirmed stages wait, after a touch or a full fill, for the close to cross back over the low (short) or high (long) of the bar that made it. Once a gap arms a stage, the stage fires once and then waits for the next gap. A small table on the newest bar shows the day's percentage change (each bar's change from the previous close, summed since the day began), the day's volume so far as a percentage change against the previous day's total, and the two volumes themselves in lakhs (units of 100,000).
How to read Fair Value Gap (FVG) Scanner v2
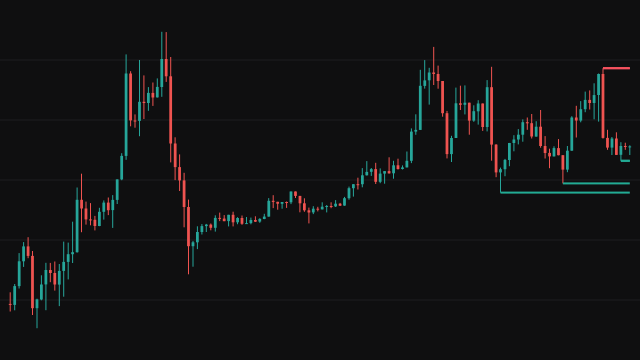
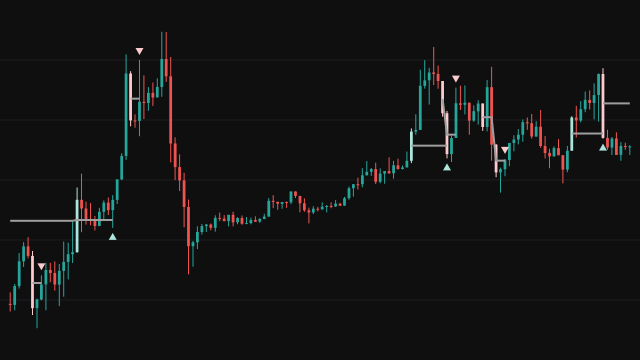
Red boxes are down gaps sitting above price, and green boxes are up gaps sitting below it. A box that still runs to the newest bar is a gap price has not filled; the stack of smaller boxes shows how far each push into it reached. Markers and candle colours show where the chosen stage fired: a short-side touch or fill is marked with a light red triangle above the bar, a long-side one with a light green triangle below. Reversal is drawn the other way round, because a close beyond the top of a down gap is bullish: the short side is marked below the bar in light green and the long side above it in light red. On the two touch stages a short-side candle is painted light red and a long-side one light green; on the fill stages and Reversal the two colours swap.
The stages are a description of how price dealt with the newest gap, not a forecast. Each side follows only its newest gap, so an older gap still on the chart does not trigger signals. FVG % marks nothing on the chart; for that stage the boxes are the whole picture. The time and date filters hold back signals outside the window, in the chart's timezone. Volume in the table is shown in lakhs with two decimals, so a symbol that trades fewer than 500 units a day reads 0 L.
Settings
- Scanning Method
- The stage the markers and candle colours report: the gap itself, the first touch, a full fill, a reversal, or the confirmation of a touch or a fill.
- Long Signals
- Show markers and candle colours for the up gaps, the ones price falls back into.
- Short Signals
- Show markers and candle colours for the down gaps, the ones price rallies back into.
- Close FVG Partially
- On, each push into a gap starts a smaller box over the unfilled part, until price trades through the far edge. Off, the first touch ends the gap.
- Max Number of FVG
- How many gaps stay on the chart. When a new one forms past this count, the oldest gap is removed with all of its boxes.
- Minimal Deviation (%)
- The smallest gap that counts, as a percentage of the 14-bar average high-low range. Raise it to keep only the larger gaps.
- Max Bars
- End a gap once its newest box has run the given number of bars, whether or not price filled it.
- Max Gap Trail Length (bars)
- How many bars a gap's newest box may run before Max Bars ends it.
- Transp
- Transparency of the gap boxes, from 0 for solid to 100 for invisible. The border is 20 points more transparent than the fill.
- Apply Time Filter
- Only allow signals on bars that open inside the time window, in the chart's timezone.
- Time From (hour)
- The hour the time window opens.
- Time From (minute)
- The minute the time window opens. A bar opening at this minute is inside the window.
- Time To (hour)
- The hour the time window closes.
- Time To (minute)
- The minute the time window closes. A bar opening at this minute is already outside it.
- Apply Date Filter
- Only allow signals on bars of one calendar date, in the chart's timezone.
- Day
- The day of the month the date filter accepts.
- Month
- The month, 1 to 12, the date filter accepts.
- Year
- The year the date filter accepts.
- Display Table
- Show the panel with the day's change, the day's volume change, the day's volume and the previous day's volume.
- Position
- Where the panel sits. Panels pin to the four corners, so a top position goes to the top and a middle or bottom one to the bottom, on the left for a left position and on the right otherwise.
- Size
- The panel's text size. Tables in this version draw at the chart's own text size, so changing it has no visible effect.
Frequently asked questions
Why does a gap leave several boxes behind?
With Close FVG Partially on, each bar that trades into the gap freezes the box it reached and starts a smaller one over the part price has not touched. The stack shows how far each push went. When price trades through the far edge, the last remnant is removed and the gap stops trailing.
Why does an old box get a touch without a marker?
The scanner follows only the newest gap on each side. Every gap on the chart keeps trailing and shrinking, but a touch, fill or reversal of an older gap does not fire a stage.
What does the Confirmed stage wait for?
After a short-side touch or full fill it records that bar's low, and fires when the close later crosses below it. On the long side it records the bar's high and waits for the close to cross above it. It turns a push into the gap into a rejection of it.
Why does FVG % show no markers?
That stage is meant for a screener across many symbols, where each new gap is the event. On a single chart the boxes already show every gap, so it adds no markers or candle colours.