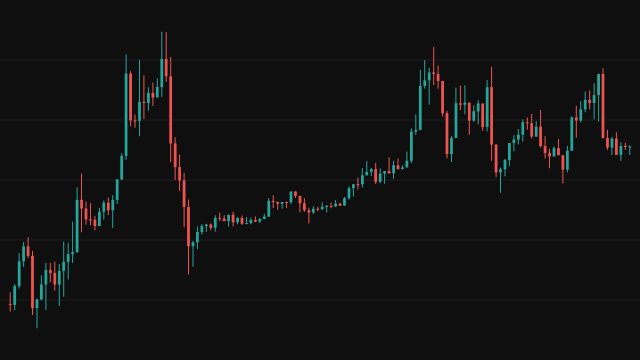
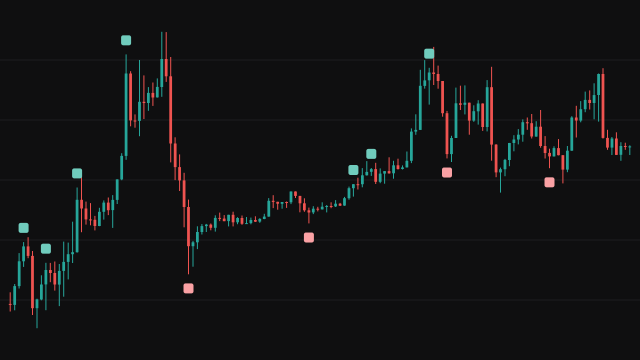
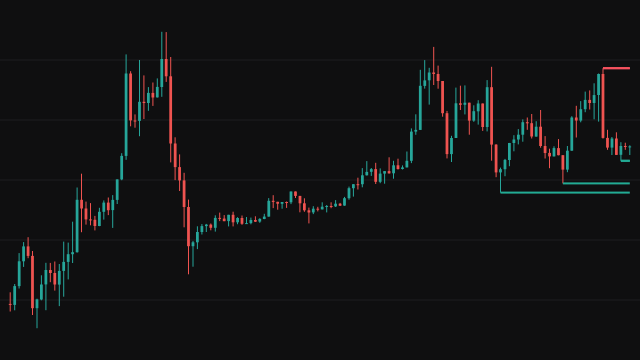
Equal Highs and Lows looks for places where the market turned at almost the same price twice in a row. It finds swing points with a pivot test: a swing high is a bar whose high stands above the highs of the Left bars before it and the Right bars after it, and a swing low is the mirror image. With the Open/Close source the test reads the top and bottom of each candle's body instead of its wicks.
Each time a new swing point of one side is confirmed, the study compares it with the previous swing point of the same side. The distance between the two is taken as a percentage of the older one. When that percentage is below Equal HL %, the pair counts as equal: a box is drawn from the earlier pivot bar to the later one, spanning the two prices, and the later pivot bar is tagged with an x at its high or low. Equal highs are drawn in red and equal lows in green. Only the newest 50 boxes are kept on the chart.
How to read Equal Highs and Lows
Two highs at nearly the same price mark a ceiling that buyers failed to clear twice, and the stops of traders who are short usually sit just above it. Two equal lows mark a floor with stops resting just below it. Many traders watch these levels for a sweep: a quick move through the level that takes out those stops and then reverses, or for a clean break that turns the level into the start of a move.
A pivot needs Right bars after it to be confirmed, so each box and tag appears Right bars after the second pivot formed. With the default of 30 bars that is a long delay, and the study describes structure that has already formed rather than calling a turn as it happens. Smaller Left and Right values find more, smaller swings.
Settings
- Left
- How many bars before a candidate bar it must stand above (or below) to count as a swing point. Larger values keep only the more significant swings.
- Right
- How many bars after a candidate bar it must stand above (or below). This is also how many bars the study waits before a swing point, and any box built on it, can appear.
- Equal HL %
- The largest distance between two consecutive swing points, as a percentage of the older one, for the pair to count as equal. Lower values demand that the two prices sit closer together.
- Source
- High/Low finds swing points on the wicks of the candles. Open/Close finds them on the candle bodies, using the higher and lower of each bar's open and close. On a market that trades without gaps, where every bar opens at the previous close, neighbouring bodies always touch, so no body stands strictly above or below its neighbours and Open/Close finds no swing points.
Frequently asked questions
Why does a box appear so long after the second swing formed?
A swing point is only confirmed once Right bars have closed after it without exceeding it. The box is drawn on the bar that confirms the second swing, but it is anchored back on the two pivot bars themselves.
Are only consecutive swing points compared?
Yes. Each new swing high is compared only with the swing high just before it, and each new swing low with the swing low just before it. Two equal highs separated by a different swing high in between are not paired.
Why do older boxes disappear?
The study keeps the newest 50 boxes, highs and lows together, and removes the oldest when a new one is drawn. The x tags on the pivot bars stay.
What value of Equal HL % should I use?
It depends on how much the instrument moves. On a market that moves a few percent a day, 0.05 percent keeps only very close matches; raise it to see looser pairs, or lower it on a quiet instrument.