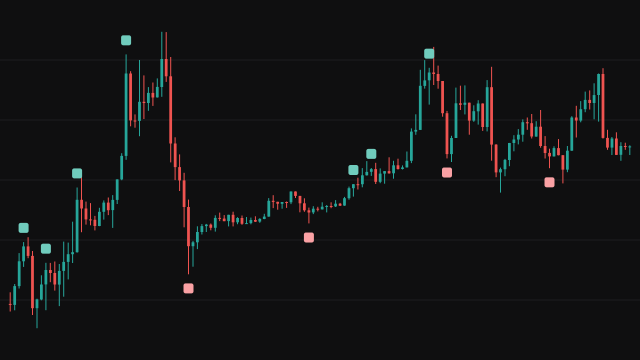
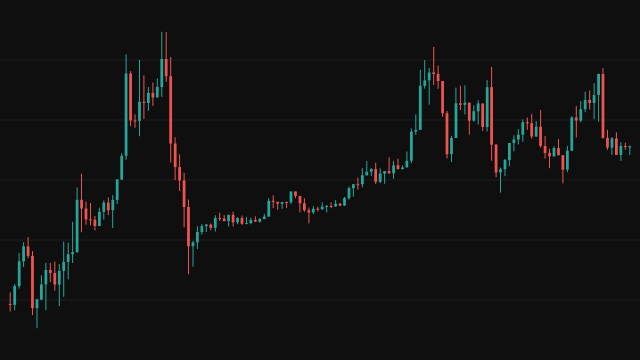
A displacement candle is a bar whose high-low range is at least a set percentage of the average high-low range of the last 14 bars and that closes in one direction: a bullish one closes above its open, a bearish one below. By default it must also close beyond the previous close, and it can be asked to close beyond the previous high or low, or to have a range wider than the ATR times a multiplier. For the first 13 bars, before the 14-bar average exists, the size test is skipped.
The study counts consecutive displacement candles on each side. A bullish candle restarts the bearish count and a bearish one restarts the bullish count. The study tracks each run's highest high and lowest low. Once a run reaches the minimum length it sets a Fibonacci level inside it: for a bullish run the high minus the range times the Fibonacci value, for a bearish run the low plus the range times the value. The level is held until the next qualifying run on the same side replaces it. When a run of at least the minimum length ends, its length is labelled on its last candle.
In Retracement mode the study then waits for price to come back into the newest run. The first bar whose low crosses down through a bullish run's level (or whose high crosses up through a bearish run's level), after a bar that sat beyond it, is flagged with a triangle, coloured, and joined to the first candle of the run by a dotted line. Each run gives at most one such signal. A small table on the newest bar shows the sum of the bar-to-bar percentage changes of the close since the day began, the day's running volume against the previous day's total, and both volumes in lakhs.
How to read Displacement Candles Scanner
A green number above a candle closes a bullish run and says how many displacement candles it held; a red number below a candle closes a bearish run. A long run marks a stretch where one side moved price in wide candles without a pause.
In Retracement mode a green triangle under a candle marks the first pull-back into a bullish run's Fibonacci level, a red triangle over a candle the first rally into a bearish run's level, and the dotted line shows the level and where the run began. The signal fires on the bar that crosses the level and does not judge whether the pull-back holds, so read it as a place to look rather than an entry by itself. The time and date filters apply only to these retracement signals.
Settings
- Scanning Method
- Displacement labels the run lengths only. Retracement also flags the first pull-back to each run's Fibonacci level, colours that bar and draws the dotted line.
- Long Signals
- Show the bullish run labels and the long retracement signals.
- Short Signals
- Show the bearish run labels and the short retracement signals.
- Minimum Bars
- How many displacement candles in a row a run needs before it is labelled and its Fibonacci level is set.
- Minimal Deviation (%)
- The smallest candle range that counts, as a percentage of the 14-bar average high-low range. Higher values keep only wider candles.
- Apply Close Above/Below Prev Close
- Require a bullish candle to close above the previous close and a bearish one below it.
- Apply Close Above/Below Prev High/Low
- Require a bullish candle to close above the previous high and a bearish one below the previous low.
- Fibonacci Value
- Where the retracement level sits inside the run: 0 at the run's far end, 1 at its start, 0.5 at the midpoint.
- Apply ATR Filter
- Require each displacement candle's range to exceed the ATR times the multiplier.
- ATR Length
- The number of bars in the ATR the filter compares against.
- ATR Multiplier
- How many ATRs a candle's range must exceed when the ATR filter is on.
- Apply Time Filter
- Allow retracement signals only between the from and to times of each day, on the chart's clock.
- Time From (Hour)
- The hour the retracement window opens.
- Time From (Minute)
- The minute the retracement window opens.
- Time To (Hour)
- The hour the retracement window closes; a bar at that exact time is outside it.
- Time To (Minute)
- The minute the retracement window closes.
- Apply Date Filter
- Allow retracement signals only on the calendar date set below.
- Day
- Day of the month for the date filter.
- Month
- Month of the year for the date filter.
- Year
- Year for the date filter.
- Display
- Show the table of the day's percentage change and volume.
- Position
- Where the table sits; each position is drawn in its nearest corner of the chart.
- Size
- Text size of the table. Tables in this version draw at the chart's own text size, so this has no visible effect.
Frequently asked questions
Why is the run length labelled one bar late?
A run is only known to have ended when a bar fails to extend it. The study sees that on the next bar and places the label back on the run's last candle, so a label never appears and then moves.
Why do the first bars of the chart count as displacement candles so easily?
The size test compares each candle with the 14-bar average range. Before 14 bars exist there is no average, the threshold is zero, and only the direction and close tests apply.
Can one run give more than one retracement signal?
No. In Retracement mode the first signal closes the run. A new signal needs a new run of at least the minimum length on either side.
What does the volume in the table mean?
Vol is the volume traded so far today and PD Vol the previous day's total, both in lakhs (hundred thousands). Vol %Chg compares the two, and %Chg adds up the bar-to-bar percentage changes of the close since the day began.