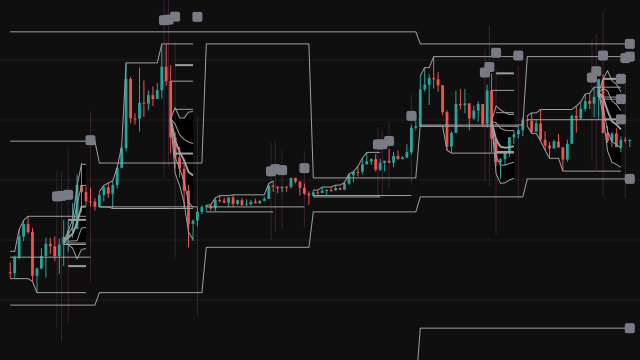
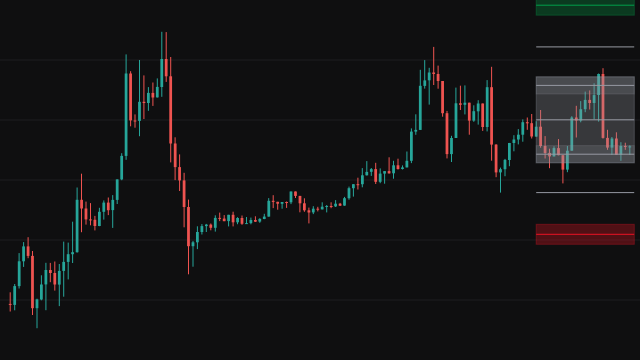
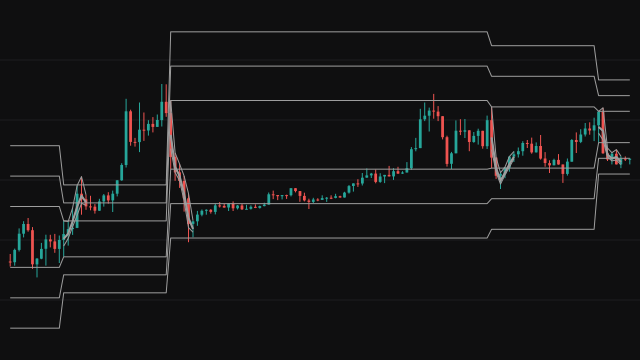
Note. The bar RVOL columns rise from the pane's axis rather than from the baseline of 1, because a plot has no base setting in this OpenScript version; and a time zone name that is not recognised stops the study instead of falling back to America/New_York, because a zone name cannot be checked before it is used.
Futures Context is a session study for intraday index futures. It measures five things on every bar and folds them into one verdict. Participation compares each session bar's volume with the average volume of the same time slot over past sessions, the same-time RVOL, and also compares session-to-date volume with what those baselines expected by now. Volatility divides a rolling realized volatility, the square root of summed squared log returns, by its own exponential average. Location tracks the session VWAP, how far price sits from it in units of its volume-weighted dispersion, its slope in ATRs and how often closes cross it.
Structure comes from a fast, mid and slow exponential average: whether they are stacked, how far apart they are in ATRs and whether price is pulling back between them. Trend quality blends the ADX, directional efficiency (net move over the path travelled), the EMA separation and the VWAP slope. A direction score adds up the EMA stack, the VWAP side and slope, the DI lines, efficiency and the side of the session open.
From these the study builds four scores between 0 and 1: trend quality, expansion, compression and balance. The regime is then chosen in order: Outside RTH, Compression, Bull or Bear Expansion, Bull or Bear Trend, Balanced Rotation, Volatility Expansion, and Transition when nothing qualifies. The confidence is how strongly the measures behind the chosen verdict agree. The pane plots the bar RVOL, the cumulative RVOL, the realized volatility ratio and, if switched on, the developing range ratio, all around a dashed baseline at 1.
How to read Futures Context
Read every plotted line against the dashed line at 1, which means normal for this time of day or this instrument. A bar RVOL column well above 1 is a bar trading far more than that slot usually does; a cumulative RVOL above 1 means the whole session is busier than usual. A realized volatility ratio above 1 means the market is moving more than its recent norm. The dashboard on the newest bar gives the regime, its confidence, the bias as a percentage from -100 to +100, and each measure behind them.
The same-time baselines need a minute-based intraday chart no longer than the maximum supported timeframe, a correct session and time zone, and enough past sessions; until then the RVOL plots are empty and participation reads Warming Up. On an hourly chart at the default settings only the volatility ratio is drawn. The relative strength input of the regime is always zero, because the study reads one instrument. The verdict describes conditions so far; it does not forecast the next bar.
Settings
- Enable indicator
- Turns the plots and the dashboard on or off. The calculation keeps running either way, so the alerts still work when it is off.
- Analysis time zone
- The IANA time zone the session hours, the session date and the session phases are read in, such as America/New_York. A name the host does not know stops the study, so spell it exactly.
- Classify outside RTH
- When off, every bar outside the regular session is reported as Outside RTH. When on, those bars get a full regime verdict from the technical measures, with no participation input.
- RTH session
- The regular session as HHMM-HHMM:days, with days numbered 1 for Sunday through 7 for Saturday. A bar is in the session when its open time falls inside the window. An end before the start crosses midnight, an equal start and end such as 0000-0000 is a full 24 hours, and text that does not follow this form puts no bar in the session.
- RTH open hour
- The hour of the session open, in the analysis time zone. Same-time slots are counted in chart intervals from this open.
- RTH open minute
- The minute of the session open. Together with the open hour it fixes slot 0 of every session.
- Historical sessions
- How many past sessions each same-time slot remembers. Older sessions drop out of the baseline as new ones arrive.
- Minimum samples before display
- How many past sessions a slot needs before its RVOL and range ratio are shown and scored. Until then participation reads Warming Up.
- Maximum supported chart timeframe
- The largest chart interval, in minutes, on which the same-time baselines run. On a longer interval the RVOL and range plots stay empty.
- Elevated bar RVOL
- Bar RVOL at or above this reads as Elevated participation and earns the full bar participation score.
- Extreme bar RVOL
- Bar RVOL at or above this reads as Extreme participation. It also sets where the column shading reaches full strength.
- Elevated cumulative RVOL
- Session-to-date RVOL at or above this reads as Elevated participation and earns the full cumulative participation score.
- Quiet RVOL
- Participation is Quiet when both the bar RVOL and the cumulative RVOL are at or below this level. It also sets where the shading of columns below 1 reaches full strength.
- Rolling return window
- The number of bars of squared log returns summed into the rolling realized volatility.
- Volatility baseline length
- The length of the exponential average of realized volatility that the volatility ratio divides by.
- Volatility z-score length
- The window of the mean and standard deviation behind the realized volatility z-score shown in the dashboard.
- Expansion ratio
- A volatility ratio at or above this reads as Expanding, and it is where the volatility expansion score reaches 1.
- Contraction ratio
- A volatility ratio at or below this reads as Contracting in the dashboard.
- VWAP source
- The price each bar contributes to the session VWAP and to its volume-weighted dispersion.
- VWAP slope lookback
- How many bars back the VWAP slope is measured. The slope is only taken once the session has run at least this many same-time slots, so on a chart longer than the maximum supported timeframe it is never taken and scores as zero.
- VWAP crossing lookback
- The number of bars over which closes crossing the VWAP are counted for the rotation test.
- Strong VWAP slope (ATR)
- A VWAP slope of this many ATRs or more earns the full slope score in trend quality.
- Rotation distance (sigma)
- Price counts as rotating only while its VWAP z-score is within this many dispersions of the VWAP.
- Crosses indicating rotation
- How many VWAP crossings in the lookback mark the session as rotating. It also scales the crossing part of the balance score.
- EMA source
- The price the three exponential averages are computed on.
- Fast EMA
- Length of the fast exponential average, the first line of the stack and the one whose slope is measured.
- Mid EMA
- Length of the middle exponential average, also the line price is compared with when the stack is tangled.
- Slow EMA
- Length of the slow exponential average, the last line of the stack.
- Slope lookback
- How many bars back the fast average's slope is measured, in ATR units.
- Compression spread (ATR)
- An EMA spread at or below this many ATRs reads as Compressed. The EMA part of the compression score is full at no spread and falls to zero at this level.
- Expansion spread (ATR)
- An EMA spread at or above this many ATRs counts as expanded, and it is where the separation score reaches 1.
- ATR length
- The average true range length used to put EMA spreads and slopes and the VWAP slope in ATR units.
- DI length
- Smoothing length of the true range and directional movement behind the two DI lines.
- ADX smoothing
- Smoothing length applied to the DI spread to give the ADX.
- Weak ADX
- ADX at or below this reads as a Weak trend. It is the start of the ADX score and the end of the ADX compression score.
- Strong ADX
- ADX at or above this reads as a Strong trend and earns the full ADX score.
- Directional efficiency length
- The window over which net movement is divided by the total path travelled.
- Weak efficiency
- Efficiency at or below this adds nothing to trend quality. It is also where the efficiency part of the compression score reaches zero, falling from its full value at zero efficiency.
- Strong efficiency
- Efficiency at or above this earns the full efficiency score and removes the low efficiency part of balance.
- Directional threshold
- The absolute direction score a bar needs before a trend or an expansion verdict can take a side.
- Trend-quality threshold
- Trend quality at or above this, with a directional bias, gives a Bull Trend or Bear Trend verdict.
- Expansion threshold
- An expansion score at or above this gives an expansion verdict, directional when the bias is strong enough.
- Compression threshold
- A compression score at or above this, without expansion, gives the Compression verdict.
- Balance threshold
- A balance score at or above this gives the Balanced Rotation verdict when no trend or expansion applies.
- Range expansion ratio
- A developing range ratio at or above this reads as Expanded and earns the full range expansion score.
- Range compression ratio
- A developing range ratio at or below this reads as Compressed in the dashboard. The range part of the compression score falls from full at a ratio of 0.45 to zero at this level.
- Show bar RVOL histogram
- Draws the same-time bar RVOL as columns, shaded by how far it sits from the baseline.
- Show cumulative RVOL
- Draws session-to-date volume against the volume the baselines expected by this slot.
- Show realized-volatility ratio
- Draws rolling realized volatility over its own exponential baseline.
- Show developing-range ratio
- Draws the session's high to low range so far over the average range past sessions had reached by the same slot.
- Visual plot cap
- Plotted values above this are drawn at the cap, so one spike does not flatten the pane. The dashboard and alerts use the uncapped values.
- Show context dashboard
- Shows the table with the regime, its confidence and every measure behind it for the newest bar.
- RVOL alert threshold
- The same-time RVOL alert fires on a session bar whose RVOL reaches this level after being below it.
- Volatility alert threshold
- The volatility alert fires on the bar the realized volatility ratio reaches this level after being below it.
Frequently asked questions
Why are the RVOL plots empty on my chart?
Same-time RVOL runs only on an intraday chart whose interval is at most the maximum supported timeframe, 30 minutes by default, and only on bars inside the RTH session. Each time slot also needs the minimum number of past sessions before it is shown. On an hourly chart, raise the maximum supported timeframe to 60 to turn it on.
How are the session days numbered?
In the RTH session setting the days run 1 for Sunday through 7 for Saturday, so 23456 is Monday to Friday. The bars are tested in the analysis time zone, and a bar belongs to the session when its open time is inside the window. For a window that crosses midnight, such as 1800-1700, the hours after midnight count as the day the window opened on. For a market that trades all day, write 0000-0000.
What does the confidence number mean?
It is the agreement of the measures behind the chosen regime, as a percentage. For a trend it averages trend quality, the strength of the bias and the lack of balance; for compression or balance it is that score itself. Outside RTH it is 100, and for Transition it is held between 35 and 72.
Does the study use a second instrument for relative strength?
No. The regime engine has a slot for relative strength against another instrument, but this study reads only the chart's own bars, so that part of the direction score is always zero and the dashboard says so.