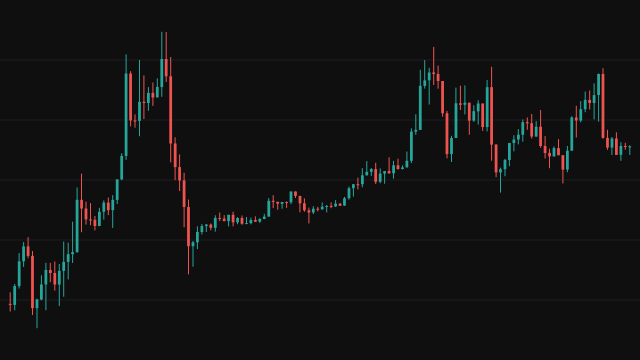
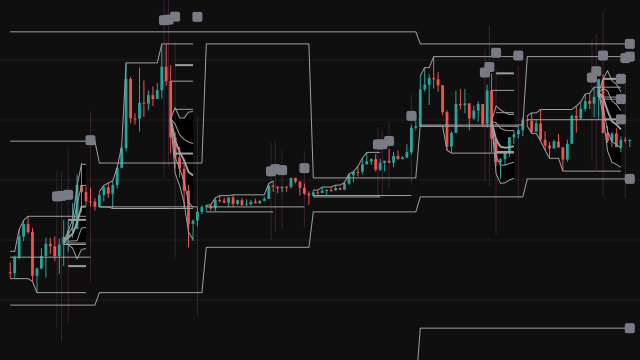
Futures Profile builds a time-price-opportunity (TPO) profile of each regular trading session. The session is cut into fixed blocks of time (30 minutes by default) and the price axis into rows a fixed number of ticks tall. Every block marks each row its high-low range touched, so a row's count is the number of blocks that traded there. The busiest row is the point of control (POC); among equally busy rows the one nearest the middle of the profile wins. The value area grows from the POC one row at a time toward the busier neighbour until it holds the chosen share of all marks (70% by default), and its top and bottom are the VAH and VAL.
The profile develops through the session: the block still forming counts toward it, so the POC, VAH, VAL and the profile midpoint move bar by bar. In Auto mode the row height is the previous session's range divided by the target row count, rounded up to whole ticks; a block that would cover more rows than the per-block limit is left out of the profile. The initial balance is the high and low of the first blocks of the session (two by default), and its extensions sit a chosen multiple of its range beyond each side.
When a session ends, its finished profile becomes the previous profile. Its POC, VAH and VAL are carried into the next session and coloured by how price treats them. The POC turns green after the chosen number of consecutive closes above it, or after a test that closes at or above it, and red for the same below. The VAH turns green when closes hold above it and red when a test closes back below it; the VAL turns red when closes hold below it and green when a test closes back above it. A VAH or VAL that has not been judged yet in the session is amber on a bar that tests it. These judgements start afresh at each session open. A previous extreme with more than one mark on its outermost row is drawn as a poor high or poor low, and runs of single-mark rows are shaded as single-print zones. An optional estimated volume profile spreads each bar's volume evenly across the rows it touched. On the newest bar the study draws both profiles as boxes and fills a dashboard that classifies the session's shape, auction state and position against the previous value area.
How to read Futures Profile
Read the developing value area as the price range the session has accepted so far, and the POC as its fairest price. The dashboard puts the levels into words. When the value area sits higher than the previous one, the POC has moved up by more than half a row and price trades above the initial balance or the developing VAH, it reads Initiative Buying (Initiative Selling is the mirror case). A session that opens above the previous value area and trades back inside it reads Responsive Selling, and, unless the POC has moved up, a Failed Upward Auction; the mirror case below reads Responsive Buying and a Failed Downward Auction. The initial balance and its extensions frame how far the session has ranged from its opening hour. Poor highs and lows and single-print zones mark places the previous session left without a clean rejection or traded only once; the study tints them when price comes back to them, but whether it does is not something the study predicts.
The profile is only as good as its block clock. It is meant for intraday charts at or below the TPO block size; on a coarser chart, or one longer than the maximum chart timeframe setting, the dashboard footer shows a timeframe warning. If a session's bars span more rows than the per-block limit, those blocks are left out and the profile can be empty, so raise the ticks per row or switch to Manual row sizing. The volume profile is an estimate from bar volume, not traded volume at each price.
Settings
- Enable indicator
- Turns the whole study on or off: levels, profiles, dashboard and alerts.
- Analysis time zone
- The IANA time zone, such as America/New_York or Asia/Kolkata, that the session window and the block clock are read in. Blank means America/New_York. A name the host does not know, or an abbreviation such as IST, stops the study with an error rather than falling back, so write the full area and location.
- RTH session
- The regular session as HHMM-HHMM, optionally followed by a colon and the trading days, where 1 is Sunday and 7 is Saturday. A window that does not read falls back to 0930-1600 Monday to Friday.
- RTH open hour
- The hour the block clock starts from. Blocks are counted from this time, so it should match the session start.
- Minute
- The minute of the hour the block clock starts from.
- TPO block size
- The length of one TPO block. Shorter blocks give more marks per session and a finer profile.
- Initial Balance blocks
- How many blocks from the session start make up the initial balance. Two 30-minute blocks give the usual first hour.
- Maximum chart timeframe
- The longest chart interval, in minutes, the dashboard accepts before it shows a timeframe warning.
- Row-size mode
- Auto sizes rows from the previous session's range and the target row count; Manual uses a fixed number of ticks per row.
- Manual ticks per row
- The row height in ticks when the row-size mode is Manual.
- Automatic target rows
- In Auto mode, the number of rows the previous session's range is divided into. More rows means shorter rows.
- Minimum automatic ticks
- The smallest row height, in ticks, Auto mode may choose.
- Maximum rendered rows
- The most boxes one drawn profile may use. Larger profiles are grouped into bands of rows for drawing; the statistics still use every row.
- Maximum rows per TPO block
- A block or bar that spans more rows than this is left out of the profile and raises the row-density warning.
- Value area percentage
- The share of all TPO marks the value area must hold. Higher values widen the VAH to VAL range.
- Show current profile
- Draw the developing session's profile as boxes from its first bar.
- Show previous profile
- Draw the previous completed session's profile as boxes from its first bar.
- Maximum TPO width (bars)
- How many bars wide the busiest row of a drawn profile is; other rows are scaled to it.
- Show TPO count on rows
- Write each drawn row band's TPO count beside the current profile.
- Show Current / Previous labels
- Label the drawn profiles CURRENT TPO, PREVIOUS TPO and EST. VOLUME above their tops.
- Highlight value-area rows
- Tint the rows inside the value area differently from the rows outside it in the drawn profiles.
- Show profile midpoint
- Plot the midpoint of the developing profile's high and low.
- Profile transparency
- How transparent the current profile's boxes are, from 0 (solid) to 90.
- Previous profile transparency
- How transparent the previous profile's boxes are, from 0 (solid) to 95.
- Show current POC / VAH / VAL
- Plot the developing POC, VAH and VAL.
- Show previous POC / VAH / VAL
- Carry the previous session's POC, VAH and VAL through the current session, coloured by acceptance or rejection.
- Show Initial Balance
- Plot the initial balance high and low.
- Show IB range extensions
- Plot the two extensions above and below the initial balance.
- First IB extension
- The first extension's distance beyond the initial balance, as a multiple of its range.
- Second IB extension
- The second extension's distance beyond the initial balance, as a multiple of its range.
- Show session open / close
- Plot the session's opening price and its latest close, which holds at the final close after the session ends.
- Closes for prior-value acceptance
- How many consecutive closes beyond a previous level count as acceptance there.
- Show previous single-print zones
- Shade the previous profile's single-print zones during the session, tinted once they are touched or filled.
- Show previous poor high / low
- Plot the previous session's high or low when its outermost row has more than one mark.
- Maximum single-print zones
- The most single-print zones drawn, lowest first.
- Show estimated volume profile
- Build and draw a volume profile that spreads each bar's volume evenly across the rows it touched.
- Maximum volume width (bars)
- How many bars wide the heaviest band of the drawn volume profile is.
- Show estimated VPOC / VAH / VAL
- Plot the estimated volume profile's POC and value area when the volume profile is on.
- Estimated volume value area
- The share of estimated volume the volume value area must hold.
- Double-distribution secondary peak
- How busy a second peak must be, as a fraction of the POC's count, to count toward a double distribution.
- Double-distribution valley ratio
- How thin the valley between the two peaks must be, as a fraction of the smaller peak, for a double distribution.
- Minimum peak separation (rows)
- How many rows a second peak must sit from the POC to count as a separate peak.
- P / b shape skew threshold
- The profile skew beyond which the shape reads as P-shaped or b-shaped rather than balanced.
- Trend-profile range / IB
- How many times the initial balance range the profile must span before it can read as a trend profile.
- Strong POC migration (rows)
- How many rows the POC must move from the previous POC to read as strongly higher or lower.
- Show Profile dashboard
- Show the dashboard with the auction, shape, value, structure, open and location readings.
- Layout with Futures Levels
- Pin the dashboard to the top right corner. Turn it off to place it with the standalone position setting.
- Standalone dashboard position
- The corner the dashboard uses when the stacked layout is off. The middle positions use the top corner on the same side.
- Dashboard text size
- Has no effect here: the dashboard uses the chart's table text size.
- Dashboard column width (%)
- Has no effect here: the dashboard sizes its columns to their text.
- Header height (%)
- Has no effect here: the dashboard sizes its rows to their text.
- Card row height (%)
- Has no effect here: the dashboard sizes its rows to their text.
- Footer height (%)
- Has no effect here: the dashboard sizes its rows to their text.
- Alert on previous POC / VAH / VAL
- Raise an alert on the bar price first tests the previous POC, VAH or VAL.
- Alert on previous single prints
- Raise an alert on the bar price first enters a previous single-print zone.
- Alert on poor high / low repair
- Raise an alert on the bar price first trades beyond a previous poor high or poor low.
- Alert on auction-state changes
- Raise an alert when the auction reading changes during the session.
Frequently asked questions
Why are the profile levels missing on my chart?
Every block that spans more rows than the per-block limit is left out of the profile. In Auto mode the very first session has no previous range to size rows from and falls back to a few ticks per row, which on a volatile instrument makes every block too tall. That session then leaves no profile behind, so the next one has no range to size from either, and the profile stays empty session after session. Switch to Manual with more ticks per row, or raise the per-block limit, and the profile fills in.
Which chart interval should I use?
An intraday interval no longer than the TPO block, such as 1, 5 or 15 minutes for 30-minute blocks. On a coarser chart a single bar covers more than one block but is counted in only one, so the profile has fewer marks than the session had blocks, and the dashboard footer shows a timeframe warning.
How is the value area built?
It starts at the POC row and adds one row at a time, choosing the busier of the row just above and the row just below (the one above on a tie), until it holds the chosen share of all TPO marks.
What makes a high or low poor?
A profile extreme is poor when its outermost row has more than one mark, which means the session traded there in more than one block without a sharp rejection. The study carries the previous session's poor extremes forward and draws them in grey on the bars where price trades beyond them.