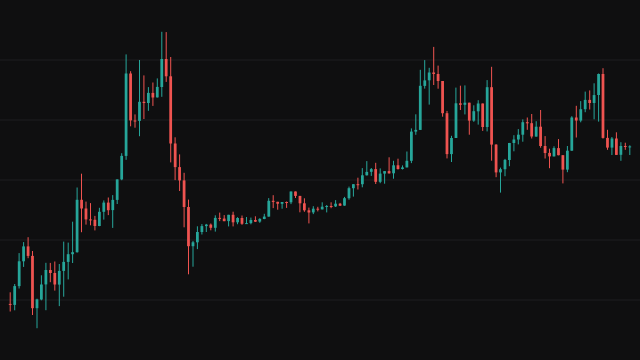
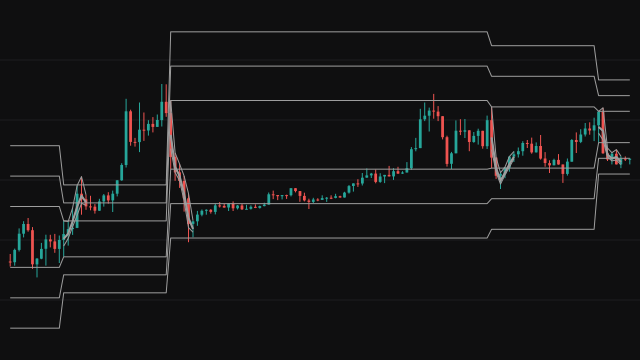
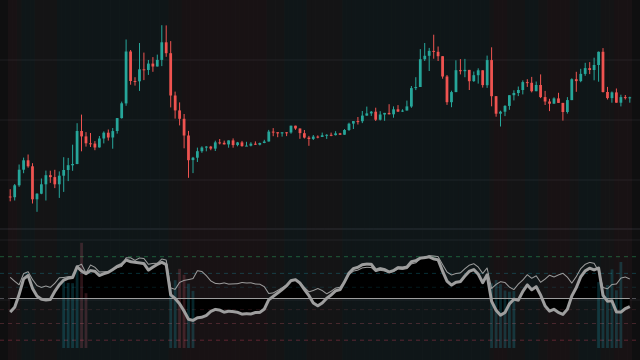
Note. The regime panel always sits in the bottom-right corner at the chart's text size, because a table's corner is fixed before the first bar and a table has no text size; the zone engine walks every bar rather than only the newest Engine history bars, and on a chart that gives no tick size the fallback tick is taken from the latest 50 closes so far rather than the chart's final 50, because a study that runs bar by bar cannot see which bar will be the newest; and a session timezone name the chart does not know stops the study instead of falling back to America/New_York, because a zone name cannot be tested before it is used.
Futures Setups Research is a setup engine for 1-minute index futures charts. It folds the chart's own bars into 5, 15, 30, 60 and 240 minute buckets that start at the futures session open, and on every bucket and on the chart itself it looks for Fair Value Gaps (a gap between the high of one candle and the low of the candle two later) and Order Blocks (the last opposite candle before a displacement candle that breaks recent structure). Zones that are too narrow or too wide against their own ATR are ignored. When price closes through a zone it is invalidated, and a gap flips into an Inversion FVG and an order block into a Breaker Block of the opposite direction, each with a shorter life.
Every active zone is scored out of 100 on every bar: up to 30 for its timeframe, kind and width, up to 25 for overlapping zones of the same direction, up to 20 for a recent break of structure or displacement, up to 15 for nearby liquidity (repeated swing pools, swept levels, the previous day and week, the overnight range and the opening range), up to 10 for market context (VWAP rejection, a weighted regime blended from all five buckets and the chart, z-score and RSI turns, relative volume at the same time of day) and up to 5 for power-of-three and opening range behaviour. A divergence against a second instrument is not available to a single-chart study, so that last category tops out at 4.
When a zone is touched inside the signal window and passes every gate (score, categories, structure, displacement, touch count, cooldown, one trade per leg, a valid stop and enough room to the nearest objective), the best one becomes a trade: entry at the close, stop just beyond the zone, and objectives at 1R, 1.5R and 2R, each drawn as a band. The trade ends at the stop, at 2R or at the time limit.
How to read Futures Setups Research
Read the panel first. Each cell gives a timeframe's regime from STRONG BEAR to STRONG BULL with its score, and ENGINE says READY only on a 1-minute chart (or a 2 to 5 minute chart with that option on) of a supported or allowed instrument; elsewhere the panel is all the study computes. On a ready chart the boxes are the active zones, labelled with their timeframe and kind, and the dashed lines are liquidity pools with at least the minimum number of touches (three by default).
A BUY or SELL label marks a trade entry with its score, and the bands show the risk to the stop and the reward out to 2R. The outcome label (STOP -1R, WIN +2R or a TIME exit) shows how it ended. These are research marks, not instructions: a mark on the newest bar can still change until that bar closes, the score rewards confluence, it does not measure the chance of a win, and when the stop and a target both fall inside one bar the stop is counted first.
Settings
- Enable indicator
- Turn zone registration on or off. Switched off, no zone is registered, so no zone is drawn and no trade is taken; the liquidity-pool lines and the regime panel still show.
- Allow symbols other than NQ/ES
- Let the engine run on an instrument whose ticker does not start with NQ, MNQ, ES or MES. A chart that names no instrument is always allowed.
- Allow chart timeframes above 1 minute
- Let the engine run on 2 to 5 minute charts as well as the 1-minute chart. Above 5 minutes the engine stays off and only the regime panel is computed.
- Session timezone
- The timezone every session window, the 09:30 opening range and the 17:00 session close are read in. Use a full area and location name such as America/New_York; a name the chart does not know stops the study with an error.
- Futures session
- The full futures session, written HHMM-HHMM with optional day digits where 1 is Sunday. It sets where the trading day rolls and when the session VWAP restarts.
- Overnight session
- The window whose high and low form the overnight range, used as a sweep level and as an objective.
- Regular trading hours
- Regular trading hours. Its first bar restarts the RTH VWAP and the opening range.
- Signal window
- The only window in which a zone touch may become a trade. Outside it, touches are still scored and reported as candidates.
- Maximum active trades
- How many trades may be open at once. A qualifying touch is ignored while this many are active.
- Show past trades
- Keep finished trades on the chart for the past-trade retention hours instead of the short default retention.
- Past-trade retention hours
- How many hours a finished trade stays drawn when Show past trades is on.
- Default completed-trade retention
- How many minutes a finished trade stays drawn when Show past trades is off.
- Engine history bars
- The number of newest bars the engine is meant to walk. This study walks every bar on the chart, so the setting has no effect here.
- Chart-timeframe zones
- Collect Fair Value Gaps and Order Blocks from the chart timeframe itself, not only from the higher buckets.
- 5-minute
- Collect zones from 5-minute buckets folded from the chart bars.
- 15-minute
- Collect zones from 15-minute buckets folded from the chart bars.
- 30-minute
- Collect zones from 30-minute buckets folded from the chart bars.
- 1-hour
- Collect zones from 1-hour buckets folded from the chart bars.
- 4-hour
- Collect zones from 4-hour buckets folded from the chart bars.
- 1m/chart zone maximum life
- The longest a chart-timeframe zone stays active, in minutes from the bar that confirmed it.
- 5m zone maximum life
- The longest a 5-minute zone stays active, in minutes.
- 15m zone maximum life
- The longest a 15-minute zone stays active, in minutes.
- 30m zone maximum life
- The longest a 30-minute zone stays active, in minutes.
- 1H zone maximum life
- The longest a 1-hour zone stays active, in minutes.
- 4H zones last until futures-session close
- Keep 4-hour zones active until 17:00 in the session timezone (at least two minutes), instead of using the fixed 4H life.
- 4H fallback maximum life
- The longest a 4-hour zone stays active, in minutes, when 4H zones do not run to the session close.
- Zone lifetime mode
- Fixed by timeframe gives every zone its full life. Shorten weaker zones cuts the life to three quarters for a moderate score and to half for a weak one.
- IFVG / BB lifetime (% of source zone)
- The life of an Inversion FVG or Breaker Block, as a percentage of the life its source zone would get, counted from the candle that flipped it.
- Full-life score
- The score at which a zone keeps its full life in the shortening mode.
- Three-quarter-life score
- The score at which a zone keeps three quarters of its life in the shortening mode. A new zone is also timed with at least this score.
- Fair Value Gaps
- Register Fair Value Gaps: a gap between the high of one candle and the low of the candle two later.
- Inversion FVGs
- Flip a Fair Value Gap into an Inversion FVG of the opposite direction when price closes through it.
- Order Blocks
- Register Order Blocks: the last opposite candle before a displacement candle that breaks the recent structure.
- Breaker Blocks
- Flip an Order Block into a Breaker Block of the opposite direction when price closes through it.
- Minimum zone width (ticks)
- The narrowest zone accepted, in price ticks taken from the chart.
- Minimum zone size / source ATR
- The narrowest zone accepted, as a multiple of the ATR of the timeframe it came from.
- Maximum zone size / source ATR
- The widest zone accepted, as a multiple of the ATR of the timeframe it came from.
- HTF displacement body / ATR
- How large a candle body must be, in ATRs, to count as displacement when finding Order Blocks.
- HTF displacement body fraction
- How much of its range a candle body must fill to count as displacement when finding Order Blocks.
- HTF structure lookback
- How many earlier candles the displacement close must clear to count as a break of structure for an Order Block.
- Pivot left
- Bars to the left a swing high or low must exceed. Swings feed the structure breaks and the liquidity pools.
- Pivot right
- Bars to the right a swing must exceed, which is also how many bars late each swing is confirmed.
- Immediate structure-event bars
- For how many bars a break of structure counts as recent for scoring.
- Same-leg structure validity minutes
- For how many minutes a break of structure counts as recent for scoring.
- Displacement validity minutes
- For how many minutes a displacement candle on the chart counts as recent for scoring.
- Execution displacement body / ATR
- How large a chart candle body must be, in ATRs, to count as displacement for scoring.
- Execution body fraction
- How much of its range a chart candle body must fill to count as displacement for scoring.
- Repeated-wick liquidity pools
- Group repeated swing highs and lows at nearly the same price into liquidity pools, and score zones near them.
- Pool tolerance in ticks
- How close, in ticks, a new swing must be to an existing pool to join it.
- Minimum pool touches
- How many swings a pool needs before it is drawn, scored or used as an objective.
- Pool lookback bars
- How many bars a pool may go without a new touch before it is dropped.
- Pool break confirmation ticks
- How far, in ticks, a close must go through a pool to break it rather than sweep it.
- Use liquidity pools as trade objectives
- Count the nearest pool in the trade direction as an objective when checking the room to the target.
- Liquidity-event validity bars
- For how many bars a sweep of a pool or a fixed level counts as recent for scoring.
- Opening Range minutes
- The length of the opening range that starts at 09:30 in the session timezone.
- Session and RTH VWAP
- Award context points when price rejects the session or RTH VWAP in the zone direction.
- RSI
- Award a context point when the RSI turns in the zone direction.
- RSI length
- The RSI length, used on the chart and on every higher bucket.
- Rolling z-score
- Award a context point when the close turns back from a stretched z-score.
- Z-score length
- How many closes the z-score mean and standard deviation cover.
- Z-score extreme
- How far, in standard deviations, the close must have been before a turn counts.
- Power-of-three session proxy
- Award an intermarket point when a sweep of a fixed level closes back on the right side of the session VWAP.
- Opening Range breakout/retest
- Award an intermarket point for a break and retest of the completed opening range.
- Same-time relative volume
- Use volume against the same time of day in earlier sessions in the context score.
- RVOL baseline sessions
- How many earlier sessions the same-time volume average covers.
- RVOL minimum samples
- How many earlier sessions are needed before relative volume is computed.
- Elevated RVOL
- The relative volume at which volume counts as elevated.
- Signal minimum score
- The score out of 100 a zone needs before a touch can become a trade.
- Minimum independent categories
- How many scoring categories must count before a touch can become a trade. The zone itself always counts, structure counts from 10 points, and every other category counts as soon as it awards a point.
- Require recent BOS/MSS
- Only trade a zone while a break of structure in its direction is recent.
- Require recent displacement
- Only trade a zone while a displacement candle in its direction is recent.
- Maximum zone touches before entry
- The most separate touches a zone may have had and still be traded.
- One trade per structural leg
- Allow only one trade per direction for each leg between breaks of structure.
- Same-direction cooldown bars
- How many bars must pass after a trade before another one in the same direction.
- Minimum space to objective in R
- The least room, in multiples of the risk, between the entry and the nearest objective level.
- Entry mode
- First touch enters on any bar that reaches the zone. Midpoint reclaim needs the bar to cross the midpoint and close back. Rejection close needs a close beyond the midpoint with a candle in the trade direction.
- ATR length
- The ATR length, used on the chart and on every higher bucket.
- Invalidation buffer ticks
- How many ticks beyond the far edge of the zone the stop is placed.
- Stop-size limits
- Automatic caps the stop at 32 ticks (12 on ES and MES), Custom uses the custom cap, and Off removes the size checks.
- Custom maximum stop ticks
- The largest stop, in ticks, allowed in Custom mode.
- Maximum stop / ATR
- The largest stop allowed, as a multiple of the chart ATR, unless the limits are off.
- Trade drawing duration
- How long a trade runs before it is closed at the time limit.
- Maximum retained trades
- The most trades kept for drawing; the oldest are dropped first.
- Setup-zone transparency
- Transparency of the zone box drawn behind an open trade.
- Risk transparency
- Transparency of the band between the entry and the stop.
- Entry-to-1R transparency
- Transparency of the band between the entry and 1R.
- 1R-to-1.5R transparency
- Transparency of the band between 1R and 1.5R.
- 1.5R-to-2R transparency
- Transparency of the band between 1.5R and 2R.
- Historical-trade transparency
- Transparency of every band of a finished trade.
- Stop/target line width
- Thickness of the stop and objective lines.
- Show multi-timeframe regime panel
- Show the table of regimes for every timeframe, the engine status and the latest candidate.
- Regime table position
- The corner the panel was meant to sit in. The panel here always sits in the bottom-right corner.
- Regime table text size
- The panel text size that was meant to be used. The panel here uses the chart text size.
- Show scores in zone labels
- Add the current score to each zone label.
- Zone label placement
- Put zone labels inside the right end of the box, or above its right edge.
- Liquidity label offset (ticks)
- How many ticks the pool labels sit away from their lines.
- Show active research zones
- Draw the active zones and their labels, newest first.
- Research zone filter
- Relevant only draws zones that score at least the candidate minimum or lie within four ATRs of the price. All active draws every active zone.
- Show active liquidity-pool lines
- Draw dashed lines for up to eight active pools that have enough touches.
- Liquidity-line forward projection
- How many minutes past the newest bar the pool lines reach.
- Show recently invalidated zones
- Keep a zone that price closed through on the chart, up to its invalidation candle, for the retention period.
- Invalidated-zone history retention
- How many minutes an invalidated zone stays drawn.
- Maximum visible research zones
- The most zones drawn at once.
- Research candidate minimum
- The score at which a touched zone counts as a candidate, for the filter and the candidate labels.
- Show rejected touched candidates
- Label each touched candidate that did not become a trade with its score and the first gate it failed.
- Enable alerts
- Turn every alert of this study on or off.
- BUY / SELL signal
- Raise an alert when a BUY or SELL trade opens.
- Target reached
- Raise an alert when a trade reaches 2R.
- Stop reached
- Raise an alert when a trade reaches its stop.
Frequently asked questions
Why does the panel say USE 1M or CHECK SYMBOL, with nothing drawn?
The zone and trade engine runs only on a 1-minute chart (or up to 5 minutes with that option on) of an instrument whose ticker starts with NQ, MNQ, ES or MES. USE 1M means the instrument is fine but the timeframe is not; CHECK SYMBOL means the instrument is not one of those. Turn on Allow symbols other than NQ/ES to run it on another instrument.
Where do the higher-timeframe zones come from?
From the chart itself. The 1-minute bars are grouped into 5, 15, 30, 60 and 240 minute buckets that start at the futures session open, and a bucket's zones are released on the first bar of the next bucket, once the bucket has closed.
Why did a strong-looking touch not become a trade?
Every gate must pass at once, and only the best qualifying zone on a bar is taken. Turn on Show rejected touched candidates to label each candidate with the first gate it failed, such as Score/categories, No structure or Outside signal window.
What decides the stop and the targets?
The stop sits a few ticks beyond the far edge of the zone, and its size must stay inside the stop limits. The risk from the entry close to the stop sets the 1R, 1.5R and 2R objectives.