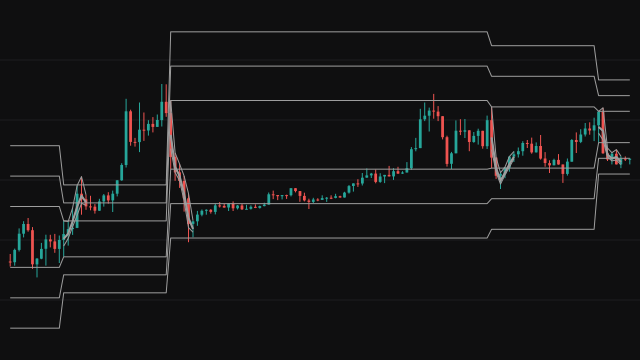
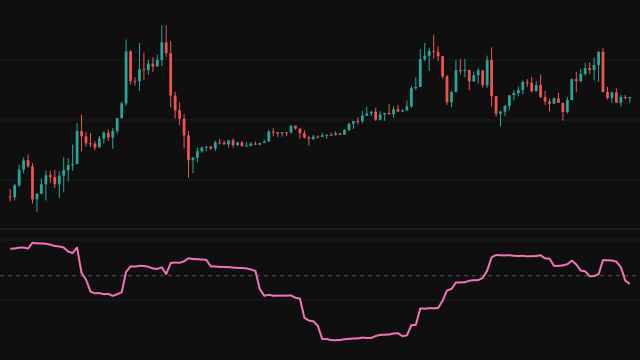
Note. The midpoint, Fibonacci and previous day and week lines are drawn solid rather than dotted or dashed, because a plot has no dotted or dashed style; the VWAP anchor menu is titled vwapAnchor in the settings dialog, because its setting is filed under its title and vwapAnchor is a built-in name; the acceptance and rejection labels are plain plates at the level price rather than pointed tags, because a drawn label has no pointer shape; and a time zone name that is not recognised stops the study instead of falling back to America/New_York, because a zone name cannot be checked before it is used.
Futures Levels draws the reference prices an intraday futures trader watches, all read in one session time zone. It tracks three sessions you write as clock windows: the full session, the overnight session and the regular trading hours (RTH). From them it builds the opening range and the initial balance, the high and low of the first minutes after the regular open; the overnight high and low; the session opens; and the previous day and previous week highs and lows, where a trading day that starts in the evening counts toward the next calendar day, as a futures daily bar does.
An anchored VWAP restarts at the regular open, the full session open or the start of each week, and sums price times volume from there. Its bands sit a chosen number of deviations away, where the deviation is either volume weighted or a plain per-bar measure. Optional Fibonacci levels split a chosen range at three retracement ratios and project it beyond each end at three more.
Two engines work over these levels. The acceptance and rejection engine watches seventeen of them on every bar: a run of closes beyond a level by a buffer is an acceptance, and a bar that wicks into a level from one side and closes back away by the buffer, with a wick of at least a minimum size, is a rejection. The confluence engine takes the levels visible on the newest bar, sorts them by price, groups those within a tolerance of the group's weighted centre, and draws the highest-scoring groups as zones. Vertical markers at 08:30, 09:30, 11:00 and 16:00 session time and a compact table complete the picture.
How to read Futures Levels
Read the lines as a map of where the session has already found buyers and sellers. Price holding beyond the opening range or initial balance after its window closes is often read as a trend day, and a return inside the range as rotation. The VWAP and its bands show where the session's volume has traded on average, and a confluence zone, especially one listing several names, marks a price where several references meet, which is where traders tend to watch for a reaction.
The state labels and alerts say what price did at a level, not what it will do next: an acceptance needs the set number of closes beyond it, so it always arrives after the move has started. The levels depend on the session windows matching the instrument, and the opening range needs bars finer than its window: on an hourly chart a 15-minute range never forms, which is why the table asks for 30-minute or finer bars.
Settings
- Enable indicator
- Turns the whole study on or off. Off, it draws no lines, labels, boxes, shading or table.
- Session time zone
- The IANA time zone every session, opening time and time marker is read in, such as America/New_York or Asia/Kolkata. A blank field uses America/New_York; a name the chart does not recognise stops the study with a message.
- Show prices in horizontal labels
- Adds the level's price after its name in each horizontal label on the newest bar.
- Show horizontal line labels
- Draws a name label beside each visible level on the newest bar.
- Horizontal-label wording
- Compact writes short tags such as ORH and PDH; Descriptive writes them out in full, such as OPENING RANGE HIGH.
- Horizontal-label height (ticks)
- How many ticks above its level each horizontal label sits, so the text clears the line.
- Full futures session
- The full trading session as HHMM-HHMM with an optional day list after a colon, 1 for Sunday through 7 for Saturday. It sets the session open and the trading day the previous-day high and low are folded over. A spec that does not follow the form falls back to the default.
- Overnight session
- The overnight window, written the same way. Its high and low become the overnight levels once it ends.
- RTH session
- The regular trading hours window, written the same way. The opening range, the initial balance and the default VWAP anchor all fall inside it.
- RTH open (hour)
- The hour, in the session time zone, that the opening range and initial balance windows start from.
- RTH open (minute)
- The minute past that hour the opening range and initial balance windows start from.
- Shade sessions
- Shades the background: strongest while the opening range forms, lighter for the rest of the regular session, faintest overnight.
- Show futures / RTH opens
- Draws the full session open and the regular session open as lines, and tracks both in the state engine and the clusters.
- Show overnight high / low
- Draws the overnight high and low during the overnight and regular sessions, and tracks them once the overnight window has closed.
- Show overnight midpoint
- Adds the midpoint between the overnight high and low.
- Show Opening Range
- Draws the opening range high and low during the regular session.
- Opening Range duration
- How long the opening range window runs from the regular open. A chart bar counts when any part of it overlaps the window.
- Show while developing
- Shows the opening range while it is still forming. Off, the lines appear only once the window has closed.
- Show midpoint
- Adds the opening range midpoint line and its label.
- Fill range
- Shades a box over the latest opening range, from its first bar to the newest bar or the end of the regular session.
- Show vertical time markers
- Draws vertical lines at 08:30, 09:30, 11:00 and 16:00 in the session time zone on an intraday chart.
- Show time-marker labels
- Adds a caption above each vertical time marker.
- Marker-label layout
- Stacked puts each word of a caption on its own line; Single line keeps it on one.
- Marker-label top padding (ATR)
- How far above the day's high a caption sits, in multiples of the 14-bar ATR. Raise it if captions overlap candles.
- Maximum marker events
- How many of the most recent time markers are kept; older ones are removed.
- Marker transparency
- How faint the vertical marker lines are, from 65 to 96 percent transparent.
- Show Initial Balance
- Draws the initial balance high and low during the regular session.
- Initial Balance duration (minutes)
- How many minutes the initial balance window runs from the regular open.
- Show Initial Balance while developing
- Shows the initial balance while it is still forming. Off, the lines appear once the window has closed.
- Show Initial Balance midpoint
- Adds the initial balance midpoint line and its label.
- Fill Initial Balance range
- Shades a box over the latest initial balance, from its first bar to the newest bar or the end of the regular session.
- Show VWAP
- Draws the anchored VWAP and its bands.
- vwapAnchor
- Where the VWAP restarts: the regular session open, the full session open, or the start of each week. With RTH or the full session, the line is drawn only inside that session unless carried.
- Source
- The price each bar contributes to the VWAP, the typical price by default.
- Deviation method
- Volume-weighted measures the band width from volume-weighted squared distance; Unweighted gives every bar in the anchor the same weight.
- Carry VWAP outside anchor session
- Keeps drawing the VWAP and bands after the anchor session ends, until the next one starts.
- Band 1
- Draws the first pair of deviation bands, and lets the state engine track them.
- Band 1 multiplier
- How many deviations the first band pair sits from the VWAP.
- Band 2
- Draws the second pair of deviation bands.
- Band 2 multiplier
- How many deviations the second band pair sits from the VWAP.
- Band 3
- Draws the third pair of deviation bands.
- Band 3 multiplier
- How many deviations the third band pair sits from the VWAP.
- Show previous day high / low
- Draws the previous trading day's high and low.
- Previous-day source
- Exchange daily bar folds every bar of the full session into the trading day; Custom RTH session uses only the regular session's high and low.
- Show previous week high / low
- Draws the previous week's high and low, with weeks built from trading days starting on Monday.
- Show Fibonacci levels
- Draws Fibonacci retracements and range projections off the chosen anchor range.
- Anchor range
- The range the Fibonacci levels are measured from: the finished opening range or initial balance, the finished overnight range, the previous day or the previous week.
- Show internal retracements
- Draws the three levels inside the anchor range.
- Show symmetric range projections
- Draws the three projections above the range high and the three below the range low.
- Retracement 1
- The first retracement, as a fraction of the range measured up from its low.
- Retracement 2
- The second retracement, as a fraction of the range measured up from its low.
- Retracement 3
- The third retracement, as a fraction of the range measured up from its low.
- Projection 1
- The first projection, as a fraction of the range added above the high and subtracted below the low. 0.272 gives the 1.272 and -0.272 levels.
- Projection 2
- The second projection, as a fraction of the range beyond each end.
- Projection 3
- The third projection, as a fraction of the range beyond each end.
- Show current confluence clusters
- Groups the levels visible on the newest bar into confluence zones and draws the strongest as boxes with a label.
- Include day / week references
- Lets the previous day and week highs and lows join the clusters.
- Include OR / IB / overnight
- Lets the opening range, initial balance, overnight levels and session opens join the clusters.
- Include VWAP / bands
- Lets the VWAP and its bands join the clusters.
- Include visible Fib levels
- Lets the visible Fibonacci levels join the clusters.
- Tolerance mode
- Whether the distance that groups levels is set in ticks or as a fraction of the ATR.
- Tolerance (ticks)
- The grouping distance in ticks when the mode is Ticks.
- ATR length
- The ATR length used when the grouping distance is set by ATR.
- ATR tolerance factor
- The grouping distance as a fraction of the ATR when the mode is ATR.
- Minimum contributors
- How many levels a group needs before it counts as a confluence zone.
- Maximum displayed clusters
- How many of the highest-scoring zones are drawn.
- Zone width left (bars)
- How many bars to the left of the newest bar each zone box starts.
- Zone padding (ticks)
- Ticks added above and below each zone so a tight group still shows as a box.
- Show contributor names
- Lists the levels that make up each zone in its label, up to six names.
- Zone transparency
- How transparent each zone's fill is, from 60 to 100 percent.
- Enable acceptance / rejection engine
- Runs the acceptance and rejection test against the tracked levels on every bar. Off, no states, labels or alerts are produced.
- Recolor levels by latest state
- Turns a level line green while its latest state is bullish and red while it is bearish.
- Touch tolerance mode
- Whether the touch distance for a rejection is set in ticks or as a fraction of the state ATR.
- Touch tolerance (ticks)
- How close, in ticks, a wick must come to a level to count as a touch when the mode is Ticks.
- State ATR length
- The ATR length used for touch distances in ATR mode, for the minimum wick and to rank events.
- Touch tolerance (ATR)
- The touch distance as a fraction of the state ATR when the mode is ATR.
- Acceptance buffer (ticks)
- How many ticks beyond a level a close must be to count as being above or below it.
- Closes required for acceptance
- How many closes in a row beyond a level, by the buffer, make an acceptance.
- Minimum rejection wick (ATR)
- The smallest rejection wick, in multiples of the state ATR.
- Show acceptance / rejection labels
- Draws a label on each bar that produced an acceptance or rejection, at the level that won that bar.
- Maximum state labels
- How many of the most recent state labels are kept.
- Per-level rejection cooldown (bars)
- How many bars must pass after an event on a level before that level can report another rejection. Acceptances are not held back.
- Show compact HUD
- Shows the table with the current session, the opening range and initial balance sizes, the VWAP and the latest state event.
Frequently asked questions
Why do I see no opening range on an hourly chart?
The opening range is built from the bars that overlap a window of 1 to 30 minutes after the regular open. With 09:30 as the open and hourly bars that start on the hour, no bar inside the regular session overlaps the first 15 or 30 minutes, so the range never forms. Use 15-minute bars or finer.
Which time zone are the sessions read in?
Every session, the regular open and the time markers are read in the Session time zone setting, not in the chart's own zone. The defaults are written in New York time, so on another market change the zone and the three session windows together.
How is the previous day high different from a calendar day high?
With Exchange daily bar, the day is the trading day of the full session, so when the session opens in the evening, everything from that open onwards belongs to the next day. With Custom RTH session, only the regular session's bars count.
What decides which level gets the label when several react on one bar?
Each event is scored by the level's weight, doubled for an acceptance, divided by one plus the distance from the close to the level in ATR units. The highest score wins the bar, and that event is the one labelled, alerted and shown in the table.